Table Of Contents
- What Is a Candlestick?
- What are the key terms in candlestick charts?
- Do Candlestick Patterns Really Work?
- Do chart patterns work in all financial markets?
- Why are Japanese candlesticks important in modern trading?
- What is the success rate of Japanese candlesticks?
- What should you do before trading with Japanese candlesticks?
- What are the 21 Japanese candlestick patterns?
- Explanation of the 21 Patterns
- 1) Doji
- What should I do when faced with a Doji?
- 2) Hammer
- What should I do when faced with a Hammer?
- 3) Hanging Man
- What should I do when faced with a Hanging Man?
- 4) Shooting Star
- What should I do when faced with a Shooting Star?
- 5) Engulfing Pattern
- What should I do when faced with an Engulfing Pattern?
- 6) Harami Pattern
- What should I do when faced with a Harami Pattern?
- 7) Piercing Pattern
- What should I do when faced with a Piercing Pattern?
- 8) Dark Cloud Cover
- What should I do when faced with a Dark Cloud Cover Pattern?
- 9) Morning Star
- What should I do when faced with a Morning Star?
- 10) Evening Star
- What should I do when faced with an Evening Star?
- 11) Three White Soldiers
- What should I do when faced with Three White Soldiers?
- 12) Three Black Crows
- What should I do when faced with Three Black Crows?
- 13) Bullish Marubozu
- What should I do when faced with a Bullish Marubozu?
- 14) Bearish Marubozu
- What should I do when faced with a Bearish Marubozu?
- 15) Tweezer Tops
- What should I do when faced with Tweezer Tops?
- 16) Tweezer Bottoms
- What should I do when faced with Tweezer Bottoms?
- 17) Rising Three Method
- What should I do when faced with a Rising Three Method?
- 18) Falling Three Method
- What should I do when faced with a Falling Three Method?
- 19) Bullish Harami Cross
- What should I do when faced with a Bullish Harami Cross?
- 20) Bearish Harami Cross
- What should I do when faced with a Bearish Harami Cross?
- 21) Inverted Hammer
- What should I do when faced with an Inverted Hammer?
- Which Types of Traders Can Get The Most Out Of Candlestick Patterns?
- The Bottom Line
Understanding Japanese Candlestick: 21 Best Patterns for Trading
Japanese candlesticks offer traders a fast, visual way to read price action, spot momentum shifts, and understand market sentiment. First developed in 17th-century Japan, these charts have endured for centuries and become an essential tool for modern traders across markets.
Whether you're a seasoned investor or just starting your trading journey, learning these patterns can improve your decision-making and help you navigate financial markets with more confidence. In this guide, I will explain the structure, interpretation, and practical application of Japanese candlestick charts, including the key patterns traders use to identify potential trends, reversals, and continuations.
Japanese candlesticks visually show open, high, low and close price levels for each timeframe and reveal market psychology
Candlestick patterns should be used alongside technical indicators and confirmation methods
Single‑candle patterns like Doji, Hammer, Shooting Star and Inverted Hammer highlight indecision or potential turning points
Two‑candle patterns such as Engulfing, Harami, Piercing and Dark Cloud Cover reveal shifting momentum and help timing entries when confirmed
Three‑candle formations, including Morning Star, Evening Star, Three White Soldiers and Three Black Crows offer stronger reversal signals if confirmed by follow‑up candles
Continuation patterns like Rising Three Method and Falling Three Method indicate trend bias and can support position‑holding or scaling decisions
You should always confirm candlestick signals with volume, broader trend context and other tools before acting
Candlestick effectiveness varies by market and timeframe, so back‑testing and demo practice help build reliability
What Is a Candlestick?
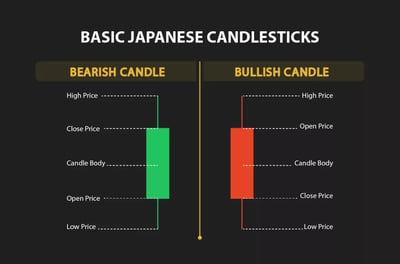
A Japanese candlestick is a visual representation of price movements within a certain trading timeframe. In retail trading, candlesticks can provide a clear picture of market dynamics. The beauty of their use is to reflect the concepts of the open, close, high, and low prices in a single candlestick figure. This makes it much easier for traders to read price patterns instantly.
From my experience, traders use these patterns to decide on the best entry and exit points for their trades, giving them the chance to more accurately manage their risk and potentially increase their returns. It’s important to mention at this point that no tool can predict market movements and guarantee success. However, Japanese candlesticks, when used with other technical analysis tools and indicators like Bollinger bands, moving averages, and Fibonacci sequences, can significantly improve a trader's ability to capture market trends. Remember, movements are influenced by an intricate web of factors, and patterns that worked in the past might not always work in the future.
Let’s understand what makes up a Japanese candlestick chart:
Candle body: The "body" of the candlestick shows the range between the opening and closing prices during a specific time period, such as a day, hour, or minute.
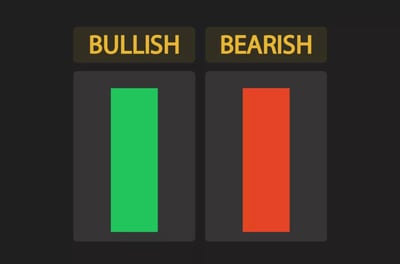
If the closing price is higher than the opening price, the body is normally filled or colored (often green or white). This shows a bullish period where buyers were in control.
If the closing price is lower than the opening price, the body is usually a different color or shaded (often red or black), revealing a bearish period where sellers were in control.
Candle wick/shadow: The "wick," also known as the "shadow," represents the price range outside of the opening and closing prices during a specific time period. The wick consists of thin lines extending from the top and bottom of the candlestick's body.
The upper wick extends from the top of the body to the highest price of that time period. It shows how high the price rose above the opening and closing prices, while the lower wick extends from the bottom of the body to the lowest price during that time period.
The wicks tell a story about price volatility and the battle between buyers and sellers during that time frame. Long wicks suggest a high level of indecision or conflict between buyers and sellers, while short wicks often mean there was less volatility.
Candle color: Candlestick colors do more than aid visuals; they reveal the relationship between opening and closing prices over a specific period.
Bullish candlestick: A candlestick that closes higher than its opening price is typically colored green or white, depending on the chart's color scheme. This indicates a bullish period in which buyers controlled the market, pushing prices higher. The body of the candlestick, the fat shape between the opening and closing prices, is filled with this color, confirming the upward movement.
Bearish candlestick: A candlestick that closes lower than its opening price is typically colored red or black. This represents a bearish period where sellers were dominant, driving prices down. Same as the bullish candlestick, the body is filled with this color to highlight the downward trend.
Traders can quickly see whether buyers or sellers controlled the period represented by each candlestick, which is crucial when making snap decisions.
What are the key terms in candlestick charts?
In my experience, here are a few terms based on candlestick charts to revisit whenever you trade:
Emerging patterns: Candlestick patterns that haven’t yet formed but are in progress.
Completed patterns: Normally, these are the patterns that have already developed, and can be regarded as either bullish or bearish signals.
Open: The opening price of a candle.
Close: The closing price of a candle.
High: The highest level the price reached during the period covered by the candle.
Low: The lowest level the price touched during the period covered by the candle.
Candlestick: Represents price movement over a specific time period, with a body showing the open and close prices and wicks showing the high and low prices.
Bullish candle: A candle where the closing price is higher than the opening price, often colored green or white. Buyers had the upper hand here.
Bearish candle: A candle where the closing price is lower than the opening price, often colored red or black. Sellers were in control and drove prices down. We've written an article about how you can react in bearish markets.
Wick/shadow: The thin lines extending from the body of the candlestick, representing the highest and lowest prices reached during the time period.
Engulfing pattern: A two-candle pattern where the body of the second candle completely covers or "engulfs" the body of the previous candle. It can be a sign of a reversal.
Trend: The general direction in which the price of an asset is moving. It can be upward (bullish), downward (bearish), or sideways (neutral).
Support and resistance: Support is a price level where buying tends to occur, and is the lowest price of an asset in a time period. Resistance is a level where selling typically occurs, and is the highest price of an asset in a time period, for more information about support and resistance please click here
Volume: The number of shares or contracts traded during a specific time frame, often used in conjunction with candlestick patterns to confirm signals.
Time frame: The period that each candlestick represents, such as one day, one hour, or five minutes.
Moving averages: A statistical calculation to smooth short-term fluctuations and highlight longer-term trends or cycles.
Go short: The practice of entering into a trade where you bet on the decline of an asset's price. By going short, you believe the price of the asset will decrease, and you can profit from the anticipated price drop.
Go long: Means to buy a financial instrument with the expectation that its price will rise in the future.
Understanding these terms and how they relate to each other is essential for effectively using Japanese candlestick charts as a trading tool. Many traders start by familiarizing themselves with these concepts, often through educational materials, courses, or practice on demo accounts.
Join a Trading Community That Moves Together
Follow top traders and learn from real strategies.
Like, comment, and engage with other investors.
Discover experts through transparent performance data.
Connect with a community built on trust and results.
Grow your knowledge while trading smarter together.
.webp)
Do Candlestick Patterns Really Work?
As a longtime trader, I would caution you that Japanese candlestick patterns are not a magic bullet. If it did, we would all be rich! For you to be successful, you must make the most of a range of analysis tools, of which Japanese candlesticks are just one type.
The short answer to whether they work is - yes, but with significant caveats. The effectiveness of these patterns depends on how they're applied, the market context, and understanding the bullish-bearish tension they represent.
When using Japanese candlesticks, traders should always pay attention to confirmation and context. While these patterns can provide useful signals, they are rarely foolproof on their own. Successful traders usually seek confirmation from market news or broader trend structure before acting on a candlestick signal. The broader market context can significantly impact whether a pattern leads to a predictable outcome.
Do chart patterns work in all financial markets?
Japanese candlestick chart patterns have been applied across various financial trading markets, including stocks, cryptocurrencies, commodities, FOREX and more. The reason for their widespread use lies in their ability to represent the fundamental principles of supply and demand, bullish and bearish forces, that are common across all markets. Here's how they function in different trading markets:
While Japanese candlestick patterns can be used across all financial trading markets, their success depends on proper understanding within the context of the specific market and current conditions. Combining them with other tools and analysis techniques, and applying proper risk-management strategies, will generally help you make more reliable and data-driven decisions.
Why are Japanese candlesticks important in modern trading?
Japanese candlestick charts are important in modern trading because they show price movements clearly and help traders read market sentiment quickly. They combine open, high, low, and close data in a format that is easy to scan during fast-moving conditions. This makes them a practical tool for spotting trading patterns and supporting decisions.
Visual clarity: These charts provide a clear visual representation of price movements, showing open, close, high, and low prices within specific time frames.
Market psychology: Candlestick patterns can uncover the underlying emotions and psychology of market players. They can also be combined with fundamental analysis to provide a comprehensive view of market conditions.
What is the success rate of Japanese candlesticks?
Japanese candlesticks can be successful, but with so many factors at play, it's difficult to establish a clear success rate. In fact, Japanese candlestick trading has been the subject of academic journals and papers, with no clear success rate emerging from these studies!
It would be irresponsible for our experts at Arincen Network to promise a defined success rate for a particular candlestick. This is impossible to do as candlestick pattern effectiveness can vary widely, depending on several factors. These variables include the time frame, the asset traded, and the trader’s execution, all of which can change how reliably a pattern performs. Beware of trading packages promising you a defined success percentage.
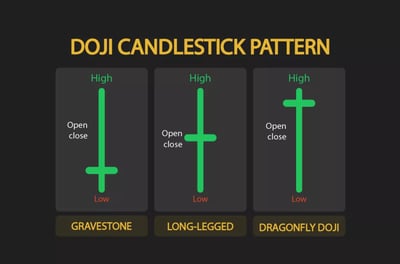
The first of the 21 Japanese candlestick patterns is the Doji, a formation that signals market indecision when the open and close are nearly the same. It is commonly used as a starting point for understanding how candlesticks reflect shifts in buying and selling pressure. Traders often study the Doji closely because it can appear before a change in trend direction.
If a pattern appears randomly within a trend, it may not be as meaningful. Also, confirmation is key. Waiting for additional confirmation, like supportive evidence from other technical indicators, can increase the chances of a successful trade.
Therefore, relying solely on candlesticks without considering market dynamics or technical and fundamental analysis can lead to mixed results. Combining it with other tools and insights usually provides a more robust trading strategy.
Remember, even with a seemingly strong signal, trades can go against you. Implementing sound risk management, like setting a stop-loss order, can protect against significant losses. Also, historical performance does not guarantee future results, so backtest any strategy and practice in a demo account to see how it might perform in different market conditions.
What should you do before trading with Japanese candlesticks?
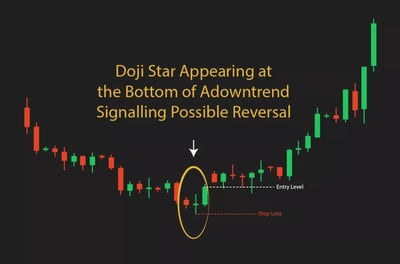
Before trading with Japanese candlesticks, you should confirm the signal with broader market context and other forms of analysis. A single candlestick, including a Doji, is not enough on its own to justify a trade. Reviewing confirmation factors helps you make a more confident trading decision.
Observe context: Look at the trend preceding the Doji. If it appears after a prolonged uptrend, it may signal exhaustion among buyers, and vice versa for a downtrend.
Wait for confirmation: Instead of taking immediate action, wait for the following candles to confirm the pattern's implication. For example, if a Doji is followed by a bearish candle in an uptrend, it might signal a reversal, and you could consider selling or shorting. If followed by a bullish candle in a downtrend, you might consider buying.
Assess other indicators: Use other technical indicators, like moving averages, to gain a clearer picture of the market's direction. A Doji in conjunction with other bearish signals might strengthen a selling decision, and the opposite for a buying decision.
Consider risk management: If you're already in a position, you might use a Doji as a cue to reevaluate your stop-loss and take-profit levels, tightening or loosening them based on the potential direction hinted at by the Doji.
Avoid knee-jerk reactions: Remember, a Doji doesn't demand immediate buying or selling; it's a sign of uncertainty. Acting hastily without further analysis or confirmation might lead to poor decisions.
Analyze volume: Paying attention to trading volume during the Doji might provide additional clues. High volume may lend more significance to the indecision, while low volume might mean it's less critical.
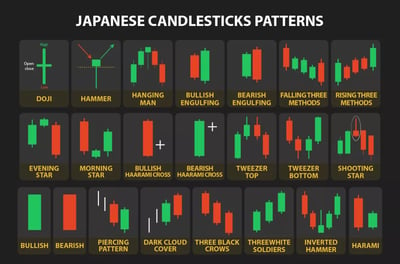
What are the 21 Japanese candlestick patterns?
Doji
Hammer
Hanging Man
Shooting Star
Engulfing Pattern
Harami Pattern
Piercing Pattern
Dark Cloud Cover
Evening Star
Three White Soldiers
Three Black Crows
Morning Star
Bullish Marubozu
Bearish Marubozu
Tweezer Tops
Tweezer Bottoms
Rising Three Method
Falling Three Method
Bullish Harami Cross
Bearish Harami Cross
Inverted Hammer
Explanation of the 21 Patterns
Here you can find an explanation for all the 22 patterns and how to handle each one of them.
1) Doji
What should I do when faced with a Doji?
A Doji candlestick pattern represents a state of indecision in the market, where the opening and closing prices are essentially the same. It can be a sign of a potential reversal or continuation, but on its own, it doesn't provide a clear buying or selling signal.
A Doji is more of a warning signal to pay closer attention rather than a direct call to buy or sell. It should prompt you to keep your eyes open, consider other indicators, and possibly prepare for action based on further confirmation. Always align your actions with your overall trading strategy, risk tolerance and understanding of the specific market you are trading.
2) Hammer
A Hammer is a candlestick with a small body and a long lower wick. This shape shows that sellers pushed price lower before buyers drove it back up near the opening level. Traders often view it as a possible bullish reversal signal after a downtrend.
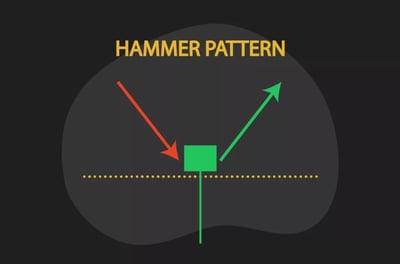
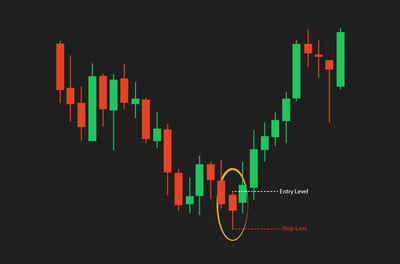
What should I do when faced with a Hammer?
If you see a Hammer pattern, especially with confirmation from a following green candle or other technical indicators, it might suggest a buying opportunity.
Traders often see this as a sign to enter a long position, anticipating an upward trend. Before trading, first look for confirmation from following candles, and, if confirmed, consider buying while employing appropriate risk management strategies.
3) Hanging Man
A Hanging Man is a candlestick pattern similar to a Hammer, but it appears at the end of an uptrend. It can signal that buying strength is weakening and that sellers are starting to push back. For that reason, traders often treat it as a possible bearish reversal warning.
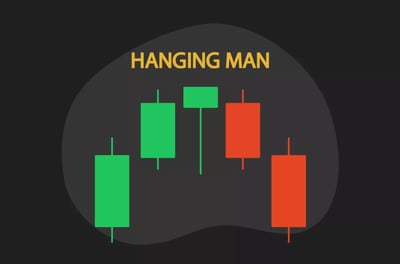
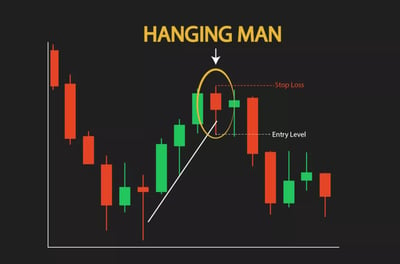
What should I do when faced with a Hanging Man?
A Hanging Man candlestick pattern is often viewed as a bearish reversal signal. It resembles a Hammer with a small body and a long lower wick but occurs during an uptrend. The normal trading response to a Hanging Man candlestick is to recognize it as a potential bearish reversal signal during an uptrend, to look for confirmation in following candles and, if confirmed, to consider selling or shorting.
4) Shooting Star
A Shooting Star is a candlestick with a small body and a long upper wick. It usually appears during an uptrend and suggests that buyers lost control after pushing prices higher. Traders often read it as a potential bearish reversal signal.
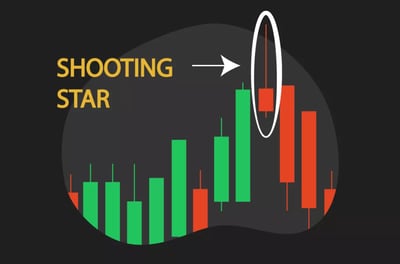
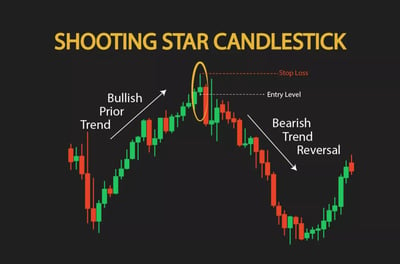
What should I do when faced with a Shooting Star?
A Shooting Star candlestick pattern is often considered a bearish reversal signal. It appears during an uptrend and has a small body with a long upper wick and little or no lower wick, resembling a shooting star. The classical trading response to a Shooting Star candlestick is to recognize it as a potential bearish reversal sign during an uptrend, to seek confirmation from the following candles, and to consider selling or shorting.
5) Engulfing Pattern
An Engulfing Pattern is a two-candle formation in which one candle’s body fully covers the body of the previous candle. This pattern can indicate a shift in momentum and is commonly used to spot possible trend reversals. Traders usually distinguish between bullish and bearish engulfing setups.
What should I do when faced with an Engulfing Pattern?
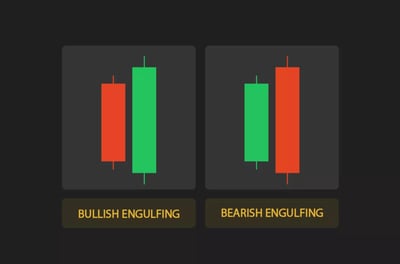
In my experience, this pattern is bullish if it occurs after a downtrend and bearish if it occurs after an uptrend. It can signal a reversal in trend. There are two types: Bullish and Bearish Engulfing.
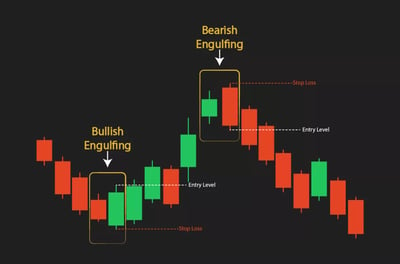
Bullish Engulfing: Confirming a downtrend. Ensure that the Bullish Engulfing pattern appears during a downtrend, with the second candle completely engulfing the first. Consider buying. If confirmed, it may signal a long position, anticipating a bullish reversal.
Bearish Engulfing: Confirming an uptrend. Ensure that the Bearish Engulfing pattern appears during an uptrend, with the second candle completely engulfing the first. Look for a subsequent bearish candle or other confirming signals. If confirmed, it may signal a short position or the sale of existing long positions, anticipating a bearish reversal.
6) Harami Pattern
A Harami Pattern is a two-candle formation that can signal a pause or possible reversal in the current trend. It involves a relationship between a larger candle and a smaller candle that reflects weakening momentum. Traders often watch for Bullish Harami and Bearish Harami variations.
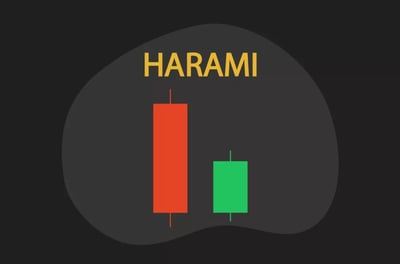
What should I do when faced with a Harami Pattern?
A Harami pattern is a two-candle formation that often signals a potential reversal or pause in the current trend. It consists of a large candle followed by a smaller candle, with the body of the smaller candle fully contained within the body of the larger candle. Like the Engulfing pattern, it comes in two forms: Bullish Harami and Bearish Harami:
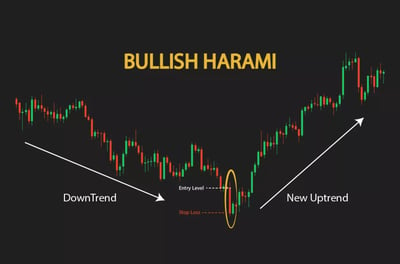
Bullish Harami: Confirming a downtrend. Look for the Bullish Harami during a clear downtrend. Wait for a subsequent bullish candle or other confirming indicators. Now may be time to consider a long position, anticipating a bullish reversal or pause in the downtrend.
Bearish Harami: Confirming an uptrend. Look for the Bearish Harami during a clear uptrend. Consider selling or shorting. If other analysis is confirmed, it may be a signal to enter a short position or sell existing long positions, anticipating a bearish reversal or pause in the uptrend.
7) Piercing Pattern
A Piercing Pattern is a bullish setup in which a bullish candle follows a strong bearish candle. It can suggest that selling pressure is fading and that buyers are beginning to regain control. Traders often interpret it as a possible reversal signal after a decline.

What should I do when faced with a Piercing Pattern?
The Piercing Pattern is a bullish reversal candlestick pattern that consists of two candles. It usually appears at the end of a downtrend. The best trading response to a Piercing Pattern is to recognize its potential as a bullish reversal signal at the end of a downtrend, seek additional confirmation and think about entering a long position with appropriate risk management.

8) Dark Cloud Cover
Description: The opposite of the Piercing Pattern.
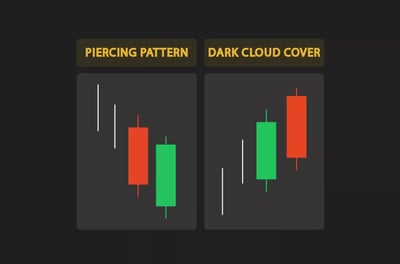
What should I do when faced with a Dark Cloud Cover Pattern?
The Dark Cloud Cover is a bearish reversal candlestick pattern that consists of two candles and is often thought of as the bearish counterpart to the Piercing Pattern. It normally appears at the end of an uptrend. The classical trading response to a Dark Cloud Cover pattern is to recognize its potential as a bearish reversal signal at the end of an uptrend. After supplementing your decision with other research, you should consider entering a short position or selling long positions.
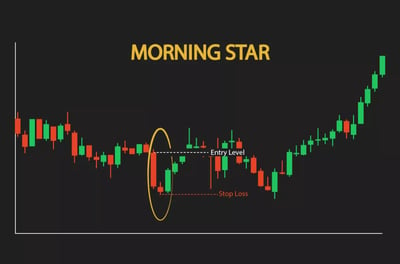
9) Morning Star
Description: A three-candle pattern signaling the start of an uptrend.
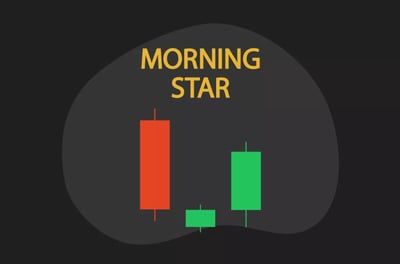
What should I do when faced with a Morning Star?
The Morning Star is a bullish reversal candlestick pattern that typically appears at the end of a downtrend. It consists of three candles: a large bearish candle, a small-bodied or doji candle and a large bullish candle. When you see a Morning Star pattern, identify its potential as a bullish reversal signal at the end of a downtrend, seek confirmation through additional candles or indicators and then consider buying to take advantage of the uptrend.
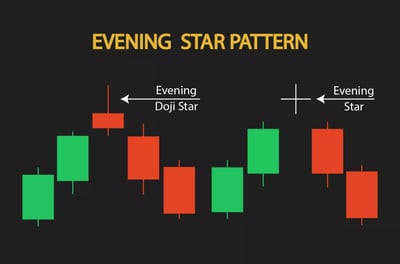
10) Evening Star
Description: The opposite of the Morning Star.
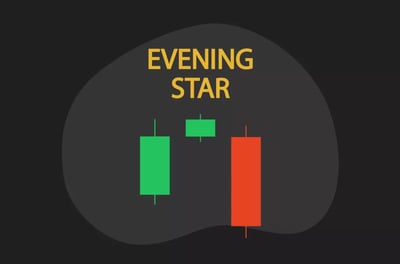
What should I do when faced with an Evening Star?
Evening Star pattern is a bearish reversal candlestick formation that often appears at the end of an uptrend. It consists of three candles: a large bullish candle, a small-bodied or doji candle and a large bearish candle. To best take advantage of this bearish reversal signal at the end of an uptrend, think about entering a short position or selling long positions.
Recommended Brokers


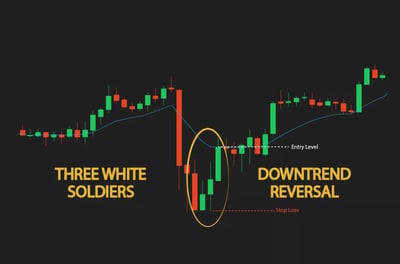
11) Three White Soldiers
Description: Three consecutive long-bodied bullish candles.
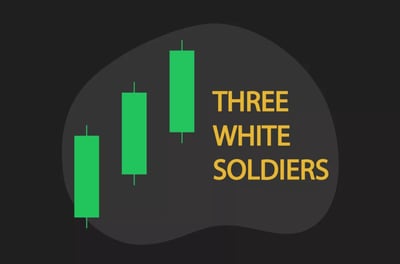
What should I do when faced with Three White Soldiers?
This pattern is a bullish candlestick formation that usually signals a strong reversal from a downtrend. It is made up of three consecutive long-bodied bullish candles, each closing higher than the previous one. The best response to a Three White Soldiers pattern is to treat it as a bullish reversal at the end of a downtrend, consider entering a long position, and manage risk with stop-losses and take-profits.
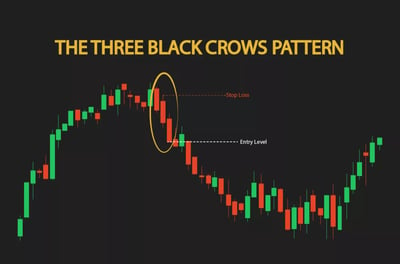
12) Three Black Crows
Description: The opposite of Three White Soldiers.
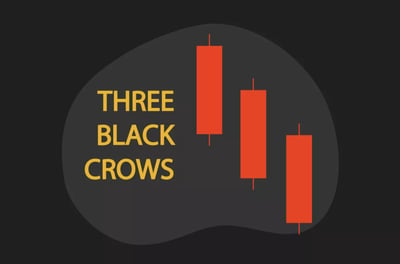
What should I do when faced with Three Black Crows?
The Three Black Crows pattern is a bearish reversal candlestick formation that typically appears at the end of an uptrend and the beginning of a downward trend. You can tell which one it is by its distinctive three consecutive long-bodied bearish candles, each closing lower than the previous one. When faced with this pattern, your financial asset is likely undergoing a strong bearish reversal at the end of an uptrend. You should consider entering a short position or selling long positions. Just remember to manage the trade with appropriate risk controls like stop-losses or take-profits.
13) Bullish Marubozu
Description: A candle without wicks, signaling strong buying pressure.
What should I do when faced with a Bullish Marubozu?
From my experience as a trader, this pattern is often used to confirm an existing uptrend. The Bullish Marubozu is a single candlestick pattern that can signify strong buying interest. It has a long body with little to no shadows or wicks, meaning the open is equal to or very near the low, and the close is equal to or very near the high of the session. Your best bet in this case is to recognize it as a potential bullish continuation or reversal signal, depending on the context. Traders might consider buying or adding to long positions. Just remember to use other technical indicators to reinforce the decision.
14) Bearish Marubozu
Description: The opposite of Bullish Marubozu.

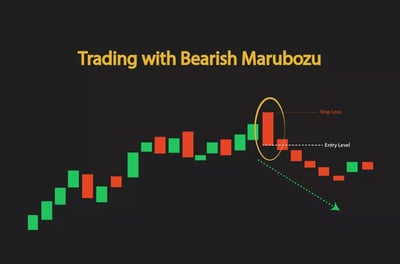
What should I do when faced with a Bearish Marubozu?
A Bearish Marubozu is a single candlestick pattern characterized by strong selling interest. It has a long body with little to no shadows or wicks, meaning that the open is equal or very near to the high and the close is equal or very near to the low of the session. It is often used to confirm an existing downtrend. This means you should treat it as a potential bearish continuation or reversal signal, depending on the context. In instances like these, you should think about selling or shorting.
15) Tweezer Tops
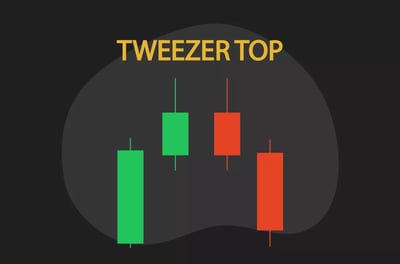
Description: Two or more candles with matching highs.
What should I do when faced with Tweezer Tops?
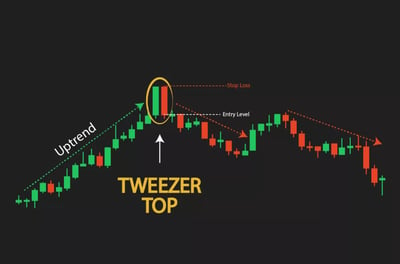
The Tweezer Tops pattern is a bearish reversal candlestick formation that typically appears at the end of an uptrend. Traders use it to predict potential reversal downward. Your best bet when faced with this pattern is to treat it as a bearish reversal signal at the end of an uptrend. As always, try to find additional confirmation through other candles or indicators, and, if validated, consider entering a short position or selling long positions.
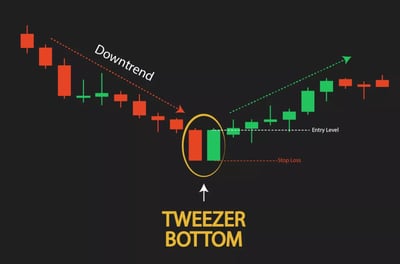
16) Tweezer Bottoms
Description: Two or more candles with matching lows.
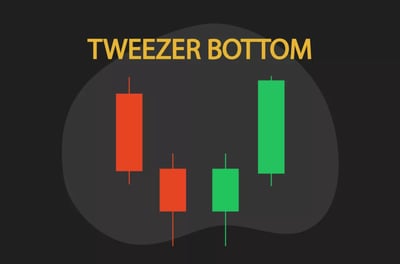
What should I do when faced with Tweezer Bottoms?
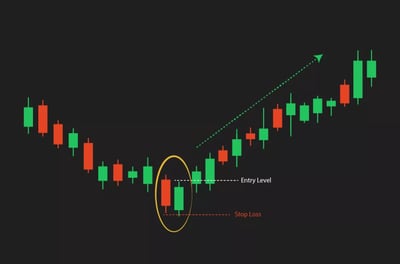
The Tweezer Bottoms pattern is a bullish reversal candlestick formation that typically appears at the end of a downtrend. The classical trading response to a Tweezer Bottoms pattern is to view it as a bullish reversal signal at the end of a downtrend. If all your other indicators confirm this, consider entering a long position or adding to long positions.
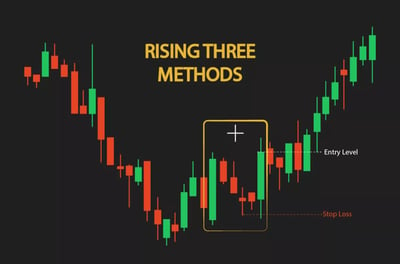
17) Rising Three Method
Description: A pattern within an uptrend with three small bearish candles.
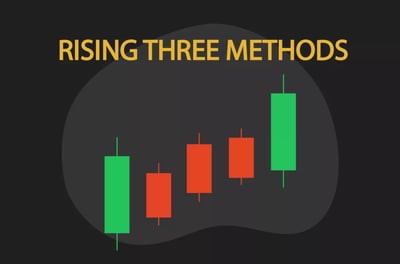
What should I do when faced with a Rising Three Method?
This pattern is a bullish continuation candlestick pattern that hints at the potential continuation of an existing uptrend. Before acting, make sure that the pattern is confirmed, then consider it as a signal to enter a long position or add to an existing position.
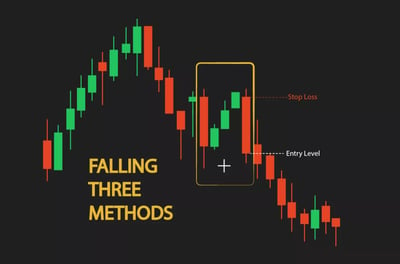
18) Falling Three Method
Description: Opposite of Rising Three Method.
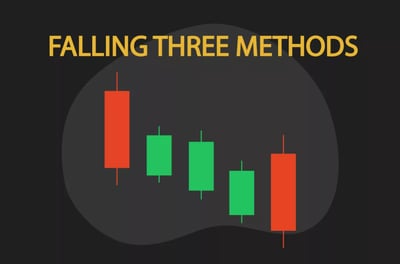
What should I do when faced with a Falling Three Method?
In my opinion, the Falling Three Method is a strong bearish continuation candlestick pattern that likely means there is a continuing downtrend in play. Like all candlestick patterns, it's crucial to remember that the Falling Three Method should be used in conjunction with other indicators and analysis techniques. Given that the Falling Three Methods is a bearish continuation pattern, the best action would be to consider taking a short position or adding to an existing short position. This is because the pattern suggests prices will likely continue to decline.
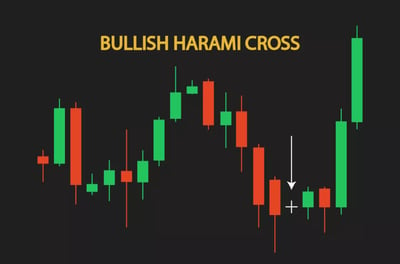
19) Bullish Harami Cross
Description: A large bearish candle followed by a Doji within its body.

What should I do when faced with a Bullish Harami Cross?
A bullish reversal candlestick pattern suggests a potential change in trend from bearish to bullish. The best course of action here is to consider entering a long position or adding to an existing long position. This is because you are anticipating a rise in the asset's price. A common strategy is to set a stop loss just below the low of the Bullish Harami Cross pattern. If the reversal doesn't pan out, your losses can be minimized.
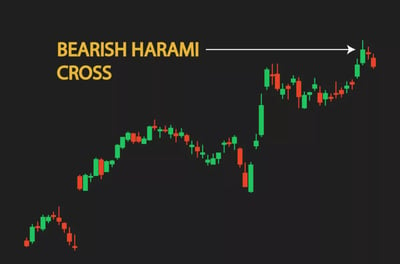
20) Bearish Harami Cross
Description: The opposite of Bullish Harami Cross.
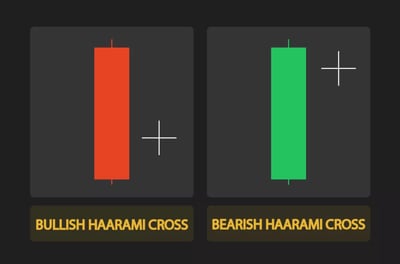
What should I do when faced with a Bearish Harami Cross?
The Bearish Harami Cross is a bearish reversal candlestick pattern that means your financial asset has possibly come to the end of a prevailing uptrend and is about to start a new downtrend. First confirm that this is the case through verifying it with other patterns and technical analysis. If it works out, now is the time to initiate a short position or exit or reduce a current long position.
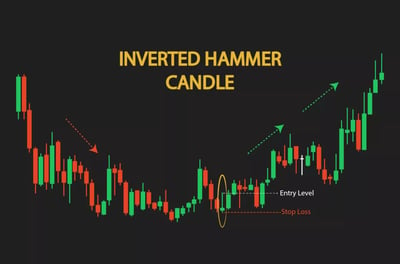
21) Inverted Hammer
Description: Similar to Shooting Star but appears after a downtrend.
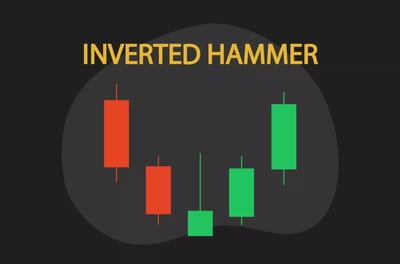
What should I do when faced with an Inverted Hammer?
The Inverted Hammer typically appears at the bottom of a downtrend. It suggests the potential for a strong return to the upside. The Inverted Hammer’s classic long upper shadow means that buyers have pushed the prices up significantly, but by the close of the period, prices retreated, ending close to where they began. This likely means that buying pressure could further build more bullish sentiment. In this case, you should consider going long so you can benefit from the bullish regains. As always, first use other measures to confirm your analysis.
Which Types of Traders Can Get The Most Out Of Candlestick Patterns?
In my opinion, Japanese candlestick patterns are versatile and can be used by a wide range of retail traders. Here's how different traders might benefit from using them:
Swing traders: Swing traders, who typically hold positions for several days to weeks, might find candlestick patterns helpful in identifying short-term momentum and potential reversals. These patterns can provide insights into market psychology over the short- to medium-term.
Day traders: These active traders buy and sell within a single trading day, often using candlestick charts to recognize intraday trends and reversals.
Technical traders: Experts and elite traders who rely primarily on technical analysis find Japanese candlestick patterns particularly useful. These traders often look for complementary signals to confirm trends they may have spotted elsewhere, and candlestick charts can provide good visual representations of these.
FOREX traders: Japanese candlesticks are very popular in the FOREX market to analyze currency pairs. They are very helpful to FOREX traders operating in markets where sentiment and direction are key.
Beginners: For newbie traders, Japanese candlesticks offer a much easier way to understand price action than other chart types. They visually represent open, close, high, and low prices in a way that is simple to interpret.
I’ve said it before, but it is worth repeating. While Japanese candlesticks can be a valuable tool, they are not foolproof and are best combined with fundamental analysis or macroeconomic context to refine trade decisions. Combining these methods provides a more holistic view of the market and can lead to better trading decisions, regardless of your trading style or focus.
The Bottom Line
Japanese candlesticks remain one of the most effective ways to read price movements and understand market psychology across different time frames. From simple one-candle signals to more advanced multi-candle formations, these patterns can help traders spot potential reversals, continuations, and shifts in momentum.
Still, no single tool is infallible. To trade more effectively, combine candlestick analysis with other technical indicators, chart patterns, and disciplined risk management. Study these patterns, practice applying them on real charts, and use them as part of a broader strategy to build confidence and improve your decision-making over time.
FAQ
Japanese candlesticks are price-chart tools that show an asset’s open, close, high, and low for a chosen time period. Their body and wicks make it easier to spot momentum, indecision, reversals, and continuation setups quickly.
While both provide similar information about price movements, candlestick charts more strongly and intuitively underscore the relationship between the opening and closing prices.
Some fundamental patterns include the Doji (indicating indecision), Bullish Engulfing (potential bullish reversal), Bearish Engulfing (potential bearish reversal), Hammer and Inverted Hammer (potential trend reversals), and the Morning Star and Evening Star (bullish and bearish reversal patterns, respectively).
While candlestick patterns provide valuable insights into market sentiment, no single pattern guarantees a particular price movement. They are best used together with other technical analysis tools and good old fundamental analysis.
Yes, candlestick patterns can be applied to any time frame, from 1-minute charts to monthly charts. However, the significance of a pattern might vary based on the timeframe. Patterns on longer time frames, like daily or weekly charts, may have a more prolonged impact than those on shorter time frames.
Absolutely! While originally developed for rice futures trading in Japan, candlestick charting can be applied to stocks, FOREX, commodities, cryptocurrencies and many other financial instruments.
Both show the same core price data, but candlesticks are easier to read at a glance. The body highlights the relationship between the open and close, helping traders see bullish or bearish pressure faster than with standard bars.
Start with the open, close, high, and low. The body shows whether buyers or sellers controlled the period, while the upper and lower wicks reveal how far price moved and where the market rejected higher or lower levels.
The body marks the distance between the open and close, while the wicks show the highest and lowest prices reached. Long wicks often suggest volatility or indecision, while a larger body can reflect stronger buying or selling pressure.
Beginners should start with the Doji, Hammer, Inverted Hammer, Engulfing patterns, Morning Star, Evening Star, and Shooting Star. These are widely used because they clearly show indecision, possible reversals, or continuation in market sentiment.
Candlestick patterns can be useful, but they are not reliable enough on their own to guarantee a trade. Their effectiveness depends on context, confirmation, the market being traded, the time frame, and how well risk is managed.
No, candlesticks work best when combined with other tools such as moving averages, Bollinger Bands, Fibonacci levels, volume, and broader market analysis. Confirmation helps reduce false signals and gives you a more balanced trading decision.
Yes, candlestick patterns can be used on any time frame, from minute charts to monthly charts. However, patterns on higher time frames often carry more weight, while shorter time frames may produce more noise and false signals.
Yes, Japanese candlesticks are used across stocks, forex, commodities, cryptocurrencies, and other markets. They remain popular because they reflect supply, demand, and trader psychology, which are relevant in nearly every liquid market.
A Doji usually signals indecision, not an immediate trade. Check the trend before it, wait for the next candle to confirm direction, review volume or indicators, and adjust your risk controls before taking any action.