Table Of Contents
- What Is Technical Analysis?
- What Are the Key Components of Technical Analysis?
- What Are the Most Important Tools and Indicators in Technical Analysis?
- What Are Chart Patterns in Technical Analysis?
- Common Chart Patterns
- What Role Does Sentiment Play in Technical Analysis?
- Limitations of Technical Analysis
- How Is Technical Analysis Applied in Practice?
- How Do You Get Started With Technical Analysis?
- Conclusion
What is Technical Analysis? Technical Analysis Explained
Technical analysis helps traders make faster, more informed decisions by studying price action, volume, and chart patterns. If you want to understand how markets move without diving deep into company financials, technical analysis offers a practical way to spot trends, manage the risks of trading, and improve your timing.In this article, I will give you a detailed introduction to TA, explain how it differs from fundamental analysis, and show why it has become a go-to method for retail traders. As always, remember that past performance is no guarantee of future performance, and you should use a range of analytical methods to inform your decisions.
What Is Technical Analysis?
Technical analysis is the study of price movements and market data to help traders identify trends and make better trading decisions. Traders use it to spot possible entry and exit points, while also comparing it with fundamental analysis, which focuses more on a company’s underlying value. Together, these ideas explain why TA is widely used in active trading.
Technical analysis is not just for stocks, and you can use it on many financial instruments as long as they have enough price and volume history. Here are some popular choices:
Stocks: Individual stocks are perfect for technical analysis, letting you study price movements and trading volumes to find trends.
FOREX: Pairs like EUR/USD or GBP/JPY are highly liquid and make the FOREX market ideal for technical analysis, especially with their 24-hour trading nature.
Commodities: Assets like gold, silver, crude oil, and agricultural products offer strong data for technical analysis and can help you catch price swings in commodities trading.
Indices: Major indices like the S&P 500, NASDAQ, or DAX give insights into broader market trends and are popular choices for trend analysis.
Remember, you can trade in indices and not just individual stocks.
Cryptocurrencies: With their volatility, cryptocurrencies like Bitcoin and Ethereum often suit technical analysis well, allowing you to capitalize on quick price changes if you get your analysis right.
Exchange-traded funds (ETF): ETFs track stocks, commodities, or other assets and are also great for technical analysis to spot trends or set entry and exit points.
Options and futures: While options and futures require a bit more knowledge due to time decay and expiration, they can be analyzed technically, especially with high-volume contracts.
Technical analysis works across these different markets, helping you spot trends, measure volatility, and find potential opportunities.
So, if you’re interested in diving deeper, these asset classes offer plenty of ground for TA strategies.
Why traders use technical analysis
Traders like using technical analysis because it’s fast, objective, and easy to access. Charts, indicators, and patterns give quick signals, helping you to avoid emotional decisions that come with human psychology. The tools for TA are available on most trading platforms, so it’s simple to use and apply. TA works in both bullish (optimistic) and bearish (pessimistic) markets, so you can spot opportunities whether prices are rising or falling. The broker will have the latest data, and they will even have education courses on how to understand what you are reading.
Here’s an article we wrote about some of the best overall brokers.
In our recent reviews of retail broker platforms, we found that even entry-level accounts now typically include charting packages with moving averages, RSI, and drawing tools, which is one reason technical analysis is often the first analytical method beginners can apply in practice.
Join a Trading Community That Moves Together
Follow top traders and learn from real strategies.
Like, comment, and engage with other investors.
Discover experts through transparent performance data.
Connect with a community built on trust and results.
Grow your knowledge while trading smarter together.
.webp)
What Are the Key Components of Technical Analysis?
Technical analysis focuses on price data, chart behaviour, and market trends rather than a company’s financial reports. Traders usually concentrate on how an asset moves in the market, using recurring patterns and signals to guide decisions. This makes TA different from approaches that rely mainly on financial reports and business performance.
Price charts
Price charts are the backbone of technical analysis, giving you a way to see market movements at a glance. There are a few types of charts you’ll come across in TA. Line charts are the simplest. connecting closing prices over time to give you a clear look at overall trends. Bar charts dig a little deeper, showing the open, high, low, and close for each trading period.
Then there are candlestick charts—probably the most popular—offering the same info as bar charts but in a way that really highlights market sentiment.
Our experts have written a detailed article on Japanese candlestick charts. These charts show how prices change over time, helping you spot trends, reversals, and patterns that might signal your next trading opportunity.
Time frames
Technical analysis works across different time frames, giving you different insights depending on your trading style. If you’re a short-term trader, like a day trader, you might focus on charts that track minutes or hours, looking for quick gains in fast-moving markets.
Medium-term traders tend to look at daily or weekly charts to catch trends that develop over weeks. Long-term traders, however, use monthly or even yearly data to spot bigger market trends. This is called swing trading. By analyzing different time frames, you get a fuller picture of market behavior, helping you understand both the short-term swings and long-term trends before making your move.
Volume
Trading volume, the number of shares or contracts traded over a given period, is critical for confirming price trends. When volume is high, it indicates a strong interest in a stock or asset, supporting price movement. For example, if a stock’s price jumps on high volume, it’s usually seen as a solid bullish signal.
On the other hand, if the price moves but the volume is low, the trend might be weak or short-lived. Keeping an eye on volume helps you gauge the strength of a trend, giving you more confidence in your trading decisions.
Technical analysis uses a set of core tools, each playing a distinct role in how traders read the market. At the foundation is price action, which includes chart types such as:
Candlestick Charts
Line Charts
Bar Charts
These all visually represent market movement.
On top of this sit indicators, such as:
Moving averages
RSI
MACD
Bollinger Bands
These all help quantify trends, momentum, and volatility.
Traders also rely on volume analysis to confirm the strength of moves, and support and resistance levels to identify key price zones where markets tend to react. The chart below brings these elements together, showing how each component contributes to the overall framework of technical analysis:
Components of Technical Analysis
What Are the Most Important Tools and Indicators in Technical Analysis?
The most important tools and indicators in technical analysis help traders read price action, measure momentum, and identify possible trend changes. Used together, they give a clearer view of market behaviour and support more informed trading decisions. Learning these indicators can also make your overall analysis more consistent.
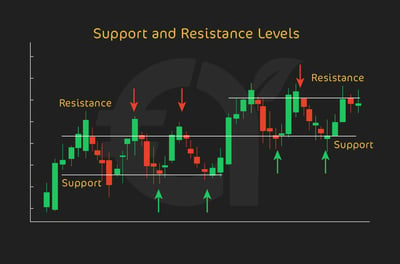
Support and resistance levels
Support and resistance are crucial concepts in technical analysis. Support is the price level where an asset tends to stop falling because demand picks up, while resistance is where price usually stops rising due to selling pressure.
You should keep a close eye on these levels to figure out the best times to enter or exit trades. If the price breaks through resistance, it’s often seen as a bullish signal. But if it drops below support, that could point to bearish momentum. Knowing these levels helps you decide when to buy, sell, or hold your position with more confidence. Just remember that the best thing about TA is that you can trade many different financial instruments, so you can try to make money from both bullish and bearish signs.
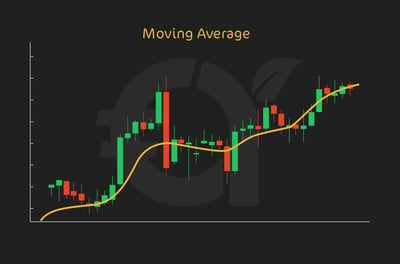
Moving averages
Moving averages are go-to indicators for smoothing out price data and spotting trends. The two main types are the simple moving average (SMA) and the exponential moving average (EMA). The SMA looks at the average price over a certain number of periods, treating all data points equally.
The EMA, on the other hand, pays more attention to recent prices. That’s why it reacts faster to current market conditions. In the real world, you would be using moving averages to find trends and possible reversal points. For instance, if the price crosses above a moving average, it might signal a good time to buy, while a drop below might mean that it’s time to sell.
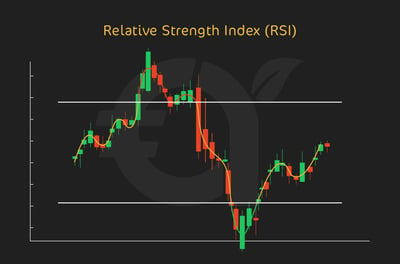
Relative strength index (RSI)
The RSI is a momentum indicator that helps you gauge whether an asset is overbought or oversold by looking at how quickly and how much the price has moved recently. It runs on a scale from 0 to 100. Be aware that readings over 70 suggest the asset might be overbought, and readings below 30 hint that it could be oversold. You should use the RSI to spot possible reversals or confirm a trend's strength. When the price hits those extreme levels, it could be a sign that a correction or rally is on the way.
Moving average convergence divergence (MACD)
MACD is a trend-following momentum indicator that tracks the relationship between two moving averages of the price of an asset. Traders often watch for MACD crossovers as signals to buy or sell. When the MACD line crosses above the signal line, it might point to a bullish trend, while a crossover below could suggest a bearish shift. This tool helps you spot changes in momentum and confirm trends.
.webp)
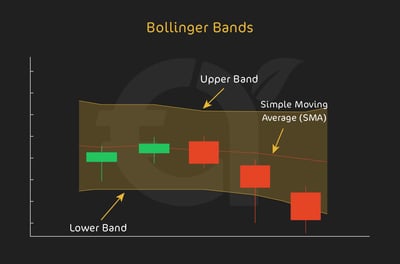
Bollinger Bands
Bollinger Bands, another popular indicator, are made up of three lines: a moving average in the middle, with two bands set two standard deviations away from that average. These bands stretch out and tighten up depending on market volatility. When prices get close to the upper band, the asset might be overbought, while moves near the lower band can signal it’s oversold. Traders use Bollinger Bands to measure market volatility and spot potential reversals, making it a handy tool for finding entry and exit points.
What Are Chart Patterns in Technical Analysis?
Chart patterns in technical analysis are recurring price formations that help traders interpret what an asset is doing. They act as a visual shorthand for spotting continuation, reversal, or uncertainty in the market. Because they simplify price action, these patterns are widely used in TA.
Trendlines
Trendlines are key tools for spotting and confirming a market's direction. By connecting a series of price points, trendlines give you a clear view of whether an asset is trending up, down, or just moving sideways.
In an uptrend, trendlines slope upward, showing that prices are rising. In a downtrend, they slope downward, indicating the market is falling. A sideways trend, or consolidation, means prices are bouncing around within a defined range, with little movement. Traders rely on trendlines to find potential buy or sell opportunities based on the market's direction.
Common Chart Patterns
Chart patterns are formations created by an asset's price movements that traders use to predict future price direction. I mention only a few of the most common chart patterns in this article, but there are many more. If you want to read a much more comprehensive article on candlestick chart patterns, read our article here.
Head and shoulders pattern
The head-and-shoulders pattern is a classic reversal signal (a potential change in an asset's trend) that hints at a reversal. It’s made up of three peaks: the middle one (the head) is the highest, while the two on the sides (the shoulders) are a bit lower.
When you see this pattern in an uptrend, it could be a sign that a bearish reversal is coming. On the flip side, an inverted head-and-shoulders pattern during a downtrend often signals a potential bullish reversal.
Double tops and bottoms
Double tops and bottoms are another set of reversal patterns to watch for. A double top happens after an uptrend when the price hits a high twice but can't push through, signaling a possible drop ahead. On the other hand, a double bottom shows up after a downtrend when the price hits a low twice but doesn’t fall any further, hinting at a potential bounce back up.
Flags and pennants
Flags and pennants are continuation patterns that indicate a brief consolidation before the trend resumes. A flag looks like a rectangle sloping against the current trend, while a pennant forms a small symmetrical triangle. Both patterns suggest that after this short pause, the price will likely keep moving in the direction of the original trend.
What Role Does Sentiment Play in Technical Analysis?
Market sentiment plays an important role in technical analysis because it reflects the overall mood of investors toward a market or asset. Even with advanced tools and data, the human element still influences price behaviour and trading decisions. Understanding this sentiment helps traders read the market more effectively.
Therefore, sentiment reflects traders' emotions and mindsets, which can significantly impact price movements. Even the most seasoned and professional traders can be victims of human emotions!
How powerful can sentiment be? Well, perhaps you remember the GameStop short squeeze in early 2021. In this case, retail traders from a Reddit community sparked a buying frenzy for GameStop stock, which had been heavily shorted by institutional investors.
Sentiment around GameStop quickly turned highly optimistic among retail traders, driven by enthusiasm, collective action, and a desire to oppose institutional investors betting against the stock.
As buying momentum grew, many seasoned traders and hedge funds were forced into a short squeeze. To cover their losses, they had to buy back the stock at increasingly high prices, further driving up GameStop’s value. The intense sentiment among retail traders led to extreme volatility, forcing even experienced investors to depart from their typical strategies. Hedge funds, caught in the squeeze, suffered significant losses as GameStop's stock price skyrocketed from under $20 in early January 2021 to an intraday high of nearly $500 later that month.
Gauging Market Sentiment Through Technical Indicators
Technical analysts use various indicators to assess market sentiment by interpreting patterns in price and volume data:
Volume analysisTrading volume shows the strength behind buying or selling pressure. When volume is high during a price increase, it suggests strong bullish sentiment, indicating that many investors are confident and buying in. On the other hand, high volume during a price drop signals strong bearish sentiment, as more investors sell. If volume is low, it could mean there's little confidence in the current trend, and a reversal may be around the corner.
Advance-decline IndicatorsThese indicators compare the number of rising stocks to the number of falling stocks within a specific index or market. If more stocks are advancing, it signals bullish sentiment, while more declining stocks point to bearish sentiment. This gives you a clearer picture of the overall market movement.
Put/call ratioThe put/call ratio compares the trading volume of put options to that of call options. A higher ratio means more traders are buying puts, betting on price drops, which signals bearish sentiment. A lower ratio points to bullish sentiment, with more traders snapping up call options, expecting prices to rise.
Sentiment Tools in Technical Analysis
Looking beyond traditional indicators, there are other novel and interesting tools designed to measure market sentiment:
Fear-and-greed indexYou might have heard of this index, developed by CNNMoney, that measures the emotions driving the market by combining seven indicators, such as market volatility, stock price momentum, and demand for safe-haven assets. It ranges from 0 (extreme fear) to 100 (extreme greed). It’s a different and somewhat interesting look at technical analysis.
Volatility indexOften called the "fear gauge," or the VIX. it measures how much volatility the market expects over the next 30 days based on S&P 500 options. When the VIX rises, it suggests investors are feeling more fear and uncertainty, while a falling VIX probably indicates greater confidence and calm.
Bullish percent index (BPI)It’s in the name. The BPI measures the percentage of index stocks trading above their point-and-figure buy signals. A high BPI shows strong bullish sentiment, with many stocks in uptrends, while a low BPI signals bearish sentiment. You can use this to get a sense of the overall health of the market.
Applying sentiment analysis to trading
Now that you understand market sentiment through these tools and indicators, you can make more informed decisions. Let’s tell you how:
Confirming trends: Sentiment indicators can back up trends spotted through other technical analysis tools. Think about it this way, if price charts show an uptrend and sentiment indicators also point to bullishness, you might feel more confident about entering long positions.
Identifying reversals: Extreme sentiment readings can hint at potential market reversals. When sentiment hits high levels of fear or greed, it might be a sign that the current trend is overextended, and a reversal could be on the way.
Risk management: Awareness of market sentiment helps you handle risk management better. In highly volatile or uncertain markets, as suggested by sentiment tools, you could choose to reduce position sizes or employ tighter stop-loss orders.
Limitations of Technical Analysis
While TA can offer great insights into market trends and price movements, it’s important to remember its limits. As I have shown, technical analysis doesn’t always predict market behavior perfectly. Financial markets are influenced by many factors, such as economic events, political changes, and sudden shifts in investor sentiment. These external factors can cause price swings that don’t align with technical indicators.
Remember, no technical indicator or chart pattern is perfect, because markets can behave irrationally or unpredictably. Indicators like moving averages, RSI, and MACD are based on past data, meaning they look backward to forecast future moves. This approach might miss real-time changes, especially in volatile markets.
Relying too much on a TA can be risky since it might cause you to overlook key data found in financial reports or broader economic conditions. It’s a good idea to combine technical analysis with other research methods, like fundamental analysis, to get a fuller picture of the market. Plus, using solid risk-management strategies, like stop-loss orders, is key to protecting against potential losses. These strategies help you avoid taking on too much risk based solely on technical signals.
How Is Technical Analysis Applied in Practice?
That said, technical analysis really does shine when you put it into practice. One popular way to do this is through backtesting, where you apply your TA strategies to historical price data to see how well they would have worked. You can get this feature on most good trading broker platforms.
Backtesting lets you test how your chosen indicators, such as moving averages or RSI, would have performed in past market conditions. It gives you insights into potential profitability and helps fine-tune your strategy before using it in live trading. While backtesting can’t guarantee future success, it’s a data-driven way to build confidence in your strategies. In our analysis of platform backtesting tools, the most useful results came when traders tested a strategy across multiple market conditions rather than a single bullish period, because that gave a more realistic view of how the setup might behave during volatility, consolidation, and trend reversals.
As I’ve said, most modern trading platforms come with built-in tools that make technical analysis easier to use. Platforms like MetaTrader, Thinkorswim, and TradingView offer a range of charts, indicators, and automated features that help traders analyze price movements and trends. With just a few clicks, you can apply TA concepts like support and resistance, moving averages, or chart patterns. These platforms also let you customize indicators and set alerts so you can stay on top of your strategy without missing a beat.
By combining backtesting with the use of advanced trading platforms, you can sharpen your TA skills and gain confidence as you turn theory into actionable trades.
How Do You Get Started With Technical Analysis?
In my view, for beginners ready to dive into technical analysis, taking actionable steps is crucial for building a strong foundation. First, pick a reliable trading platform whose charting tools, indicators, and data fit your trading goals and experience level. The best platforms give you access to price charts, historical data, and the key technical analysis features you’ll need to analyze market trends effectively.
Once you have your platform, start by learning to read basic price charts, such as line, bar, or candlestick charts. Understanding how prices move on these charts is essential for applying technical analysis. Then, try out simple indicators like moving averages and the RSI. These tools help you to spot trends and possible price reversals without adding too much complexity.
Before you invest any real money, it’s a good idea to use a demo account. Most platforms offer these accounts, letting you practice technical analysis in real-time market conditions without any financial risk. Testing your strategies in a simulated environment helps you gain confidence and learn from mistakes without risking your hard-earned cash. This hands-on approach gives you the chance to refine your skills and be better prepared for real-world trading with a solid understanding of technical analysis.
Conclusion
As I’ve shown in this article, technical analysis is a powerful tool that helps you understand market trends and make more informed decisions. TA provides a structured framework for interpreting price movements, identifying trends, and spotting potential opportunities.
However, as with any skill, mastering technical analysis requires continuous learning and practice. The more you dive into charts, indicators, and patterns, the better equipped you’ll be to navigate the markets with confidence. That said, don’t rely solely on technical analysis. Combining it with other strategies, like fundamental analysis, can give you a more balanced approach to trading and help you make smarter, well-rounded decisions. Keep learning, practicing, and refining your strategies to stay ahead in the game!
FAQ
Technical analysis studies past price, volume, and chart behaviour to estimate possible future moves. Traders use it to spot trends, momentum shifts, and potential entry or exit points across different markets.
Technical analysis focuses on charts, price action, and indicators, while fundamental analysis looks at value drivers like earnings, revenue, and economic conditions. One studies market behaviour, the other studies what may justify the price.
Start with simple, widely used tools such as moving averages and RSI. Once you understand those, you can add MACD, Bollinger Bands, and support and resistance to build a clearer trading framework.
It can be used in stocks, forex, commodities, indices, cryptocurrencies, ETFs, and even some options and futures markets. It works best where there is enough reliable price and volume history to analyse.
No, using technical analysis alone can leave gaps in your decision-making. It is usually stronger when combined with fundamental analysis, sentiment awareness, and disciplined risk management.
Backtesting is very useful because it shows how a strategy would have behaved on historical data. It cannot promise future results, but it can help you refine rules and build confidence before trading live.
A demo account is usually the safest place to begin. It lets you test chart reading, indicators, and trade ideas in live market conditions without putting real capital at risk.
Volume is one of the clearest confirmation tools. If price is moving with strong volume, the trend is usually more convincing. If volume is weak, the move may lack conviction and be more likely to fade.
Yes, beginners can start with basic charts, trendlines, moving averages, and RSI. Using a demo account and a platform with built-in tools makes it easier to practise without risking real money too early.
Candlestick charts are often the most popular because they show open, high, low, and close clearly. Line charts are simpler for trend direction, while bar charts offer more detail for price movement analysis.
Support and resistance mark areas where price often reacts. Traders use them to plan entries, exits, and stop-loss levels, and to judge whether a breakout may signal bullish strength or bearish weakness.