Table Of Contents
- What is swing trading?
- What is a swing trading indicator?
- How do swing trading indicators work?
- What are the best indicators for swing trading?
- 1. Moving average indicator (MA)
- What is SMA in swing trading?
- What is EMA in swing trading?
- How does volume help in swing trading?
- What are Bollinger Bands in swing trading?
- What is Ease of Movement (EoM)?
- What is RSI in swing trading?
- What is the Stochastic Oscillator?
- What are the best swing trading tools to use?
- Support and resistance lines
- What are chart patterns in swing trading?
- Conclusion
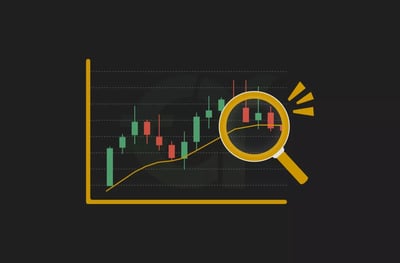
8 Best Indicators for Swing Trading and How to Use Them
Indicators for swing trading can help you spot trend shifts, time entries better, and manage risk with more confidence. If you want to capture short- to medium-term price moves without the constant pressure of day trading, learning how these tools work is essential.
In this article, you will discover the 8 best indicators swing traders use to identify support and resistance levels, confirm momentum, and make smarter trading decisions. Used correctly, these tools can help you understand price action more clearly and approach swing trading with a more structured strategy.
Swing trading targets price swings over hours, days, or weeks, focusing on support and resistance shifts rather than intraday volatility.
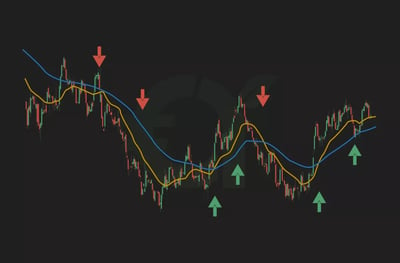
Trend indicators like moving averages help identify the market direction and smooth out price noise.
The simple moving average (SMA) and exponential moving average (EMA) are both essential for spotting trend changes and dynamic support or resistance.
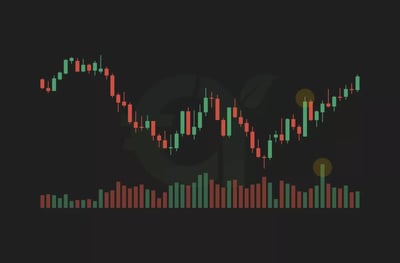
Volume-based indicators reveal the strength behind price moves
Bollinger Bands highlight periods of high and low volatility and can signal breakouts or reversals when price reaches the bands’ extremes.
Ease of Movement (EoM) combines volume and price range to indicate how effortlessly price is shifting, useful for spotting early trend moves.
The Relative Strength Index (RSI) gauges momentum by measuring overbought or oversold conditions, guiding entry and exit timing.
The Stochastic Oscillator tracks closing price relative to its range, offering insights into potential turning points based on momentum shifts.
What is swing trading?
Swing trading is a trading strategy that aims to capture short- to medium-term price swings by entering and exiting a market at favorable moments. It focuses on identifying an asset’s movement over time and riding a trend before it reverses. When traders recognize upward or downward momentum early, they can pursue gains while managing losses more effectively.
As is widely known to anyone familiar with financial markets, cryptocurrency markets can be extremely volatile. This means that swing trading in crypto can be profitable or risky, reflecting market volatility. Luckily, traders have a number of tools at their disposal that both minimize risk and ensure the best chances of making a profitable trade. Whereas technical analysis (TA) can be used to look for attractive trading opportunities, fundamental analysis (FA) is useful when analyzing fundamental price trends and patterns.
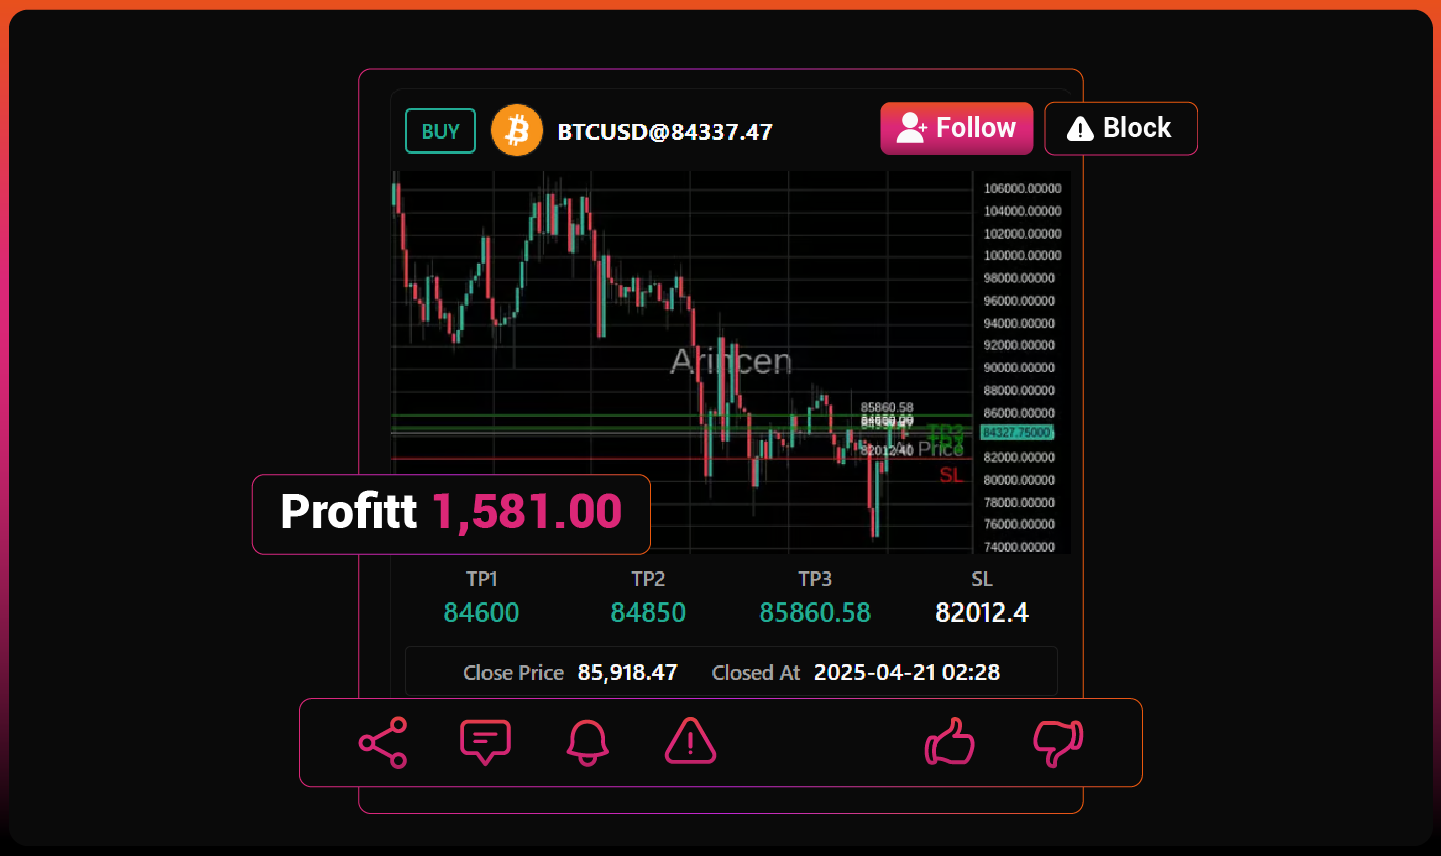
Trade with Real-Time Expert Signals
Follow live signals from experienced traders.
Get entry price, TP levels, SL, and closure updates.
Receive instant alerts when targets or stops are hit.
Track performance with clear, transparent stats.
Stay aligned with the market in real time.
What is a swing trading indicator?
A swing trading indicator is a technical tool traders use to time entries and exits during short- to medium-term market moves. It supports the swing-trading process by helping traders judge momentum, trend direction, or possible reversals. These indicators are commonly used in FOREX, stock trading, and cryptocurrencies.
While it is typically applied in FOREX and stock trading, it can also work well with cryptocurrencies, as will be explained below.
With swing trading, you hold your position for several hours, days or weeks, as long as the trend stays in your favor. Traders would start closing their position when the trend starts showing signs of waning. Given that swing traders operate with longer timeframes, they are not interested in short-term price volatility the same way as day traders are. For swing traders, the only thing that matters is that swing highs go higher in a bullish market while swing lows go lower in a bearish market.
There are two swings for which traders of this style will specifically watch:
Swing highs: When a market hits a peak before retracing, providing an opportunity for a short trade.
Swing lows: When a market hits a low and bounces, providing an opportunity for a long trade.
Naturally, identifying these movements demands a system of analysis. These are the very swing trading indicators about which we speak. Any analysis tools that allow you to make informed decisions about swing trading are based around indicators.
How do swing trading indicators work?
These indicators help traders discern whether the trend is bullish or bearish, and if it still has momentum, among other factors. While some swing traders rely on FA to validate the logic of their overall approach, technical indicators help determine the best entry and exit points for individual trades. The three most important types of swing-trading indicators are:
- Trend indicators – These indicators show you which direction the market is going and whether you can identify a trend at all. Generally, trend indicators are used to smooth price volatility to highlight the primary trend. Moving averages are the most common type of trend indicators.
- Momentum indicators – These indicators show how strong a trend is and whether a reversal might be on the horizon. They can also show the overbought or oversold levels. The Relative Strength Index (RSI) is a popular momentum indicator that you will learn more about below.
- Volume indicators – Volume is an important indicator that shows how many traders are buying and selling an asset at any given point in time. This can help you confirm the strength of a trend. High volume means high strength, while low volume indicates the exact opposite. Tools like Fibonacci indicators and Bollinger bands can also infer what the market is doing at any given time.
What are the best indicators for swing trading?
Below are eight swing-trading indicators that stand out for their simplicity and efficiency. However, it is worth noting that these in no way guarantee consistent profits. That is mainly because technical indicators do not predict the future, but rather help you better visualize the present and past.
This shortlist reflects patterns I have seen repeatedly when reviewing daily and 4-hour charts across crypto, forex and equities, where these indicators tend to be the most practical for spotting swing entries, exits and trend exhaustion.
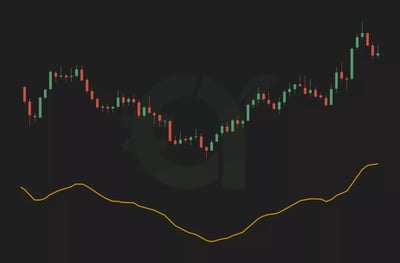
1. Moving average indicator (MA)
A MA is the first technical indicator. It has been used for decades for TA of the commodities and company shares. As the name suggests, swing traders use MA to calculate the average of an asset’s price movement over a given period of time. As a result, MAs smooth out the short-term volatility that may otherwise confuse traders.
It is important to understand that MAs are lagging indicators and rely on past price action. Thus, it would help if you used them to confirm a trend rather than try and predict future moves.
Notwithstanding, you should distinguish between short-, medium- and long-term MAs, depending on how many periods you monitor. For example, short-term MAs have a period between five and 50, while medium-term MAs have up to 100. There are two main types of MAs: Simple Moving Averages (SMA) and Exponential Moving Averages (EMA).
What is SMA in swing trading?
SMA, or simple moving average, is an indicator that helps swing traders identify the trend direction of an asset. It shows whether the market is behaving in a bearish or bullish way over a selected period. By understanding that direction, traders can make more informed trade decisions.
What is EMA in swing trading?
EMA, or exponential moving average, is a moving average indicator that gives more weight to recent price points than older data. Because it reacts faster to current market action, it can help swing traders refine entries and exits. It may also highlight important support levels during a trade setup.
In short, the best way to use MA is to watch for a short-term MA crossing a longer-term MA. If the former crosses the more extended MA from bottom to top, this is a bullish signal, and vice versa. In faster markets, especially during high-volatility sessions, I have found that EMA crossovers usually react sooner than SMA crossovers, but they also tend to produce more false signals when price is moving sideways.
How does volume help in swing trading?
Volume helps in swing trading by showing how strong a new trend may be. It reflects how much buying or selling activity is taking place in an asset at a given time. In general, higher volume suggests stronger market conviction behind the move.
Volume is especially useful with breakout strategies, i.e., when an asset’s price “breaks” above a resistance line or below a support line. More on this below. If the breakout is accompanied by high volume, then the new trend is expected to be substantial. The principle here is straightforward: a trend with high volume is going to be stronger than one with weak volume. With more traders buying or selling, there is a better basis for the price action.
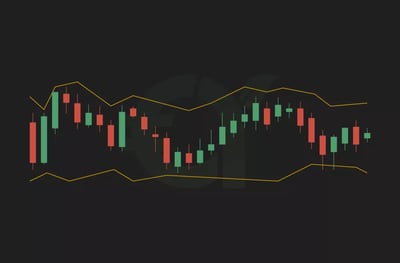
What are Bollinger Bands in swing trading?
Bollinger Bands are a momentum indicator made up of three lines: a moving average and two standard deviations. Swing traders use them to spot trend direction, overbought and oversold levels, and changes in volatility. This makes the indicator useful for reading market conditions quickly on a chart.
The width of the BB increases in tandem with the volatility and declines when the market calms down. The closer the bands are to each other, the lower the volatility.
While BBs work well in trending markets, they do a great job when the price ranges, i.e., moving up and down inside a horizontal channel. In this case, when the price touches the BB’s upper line, swing traders may go short. When the price touches the lower line of the indicator, this may precede a rebound.
The point is that the price would always tend to move toward the center of the BB. If the band starts expanding, it means that a new trend is forming, and you should not be trading in a range anymore.
Recommended Brokers


What is Ease of Movement (EoM)?
Ease of Movement (EoM) is an indicator that shows how volume relates to price changes in a market. It helps traders see whether prices are moving easily or whether more effort is required to push the market. This can reveal when market movement is happening on comparatively low trading volume.
The EoM is a technical analysis tool that combines price momentum with volume to juxtapose the two against each other strongly. It is used to determine if the price is rising or falling with ease. The concept is if the price is moving with ease, it will continue to do so for a time where trades can be planned.
The EoM indicator is plotted against a baseline set at zero. If the EoM moves upward, it means the price is moving up with ease, and, likewise, when it moves below zero, the price is falling with ease.
A price rise with a spike in EoM, but no rise in volume, indicates weakening bullish force and growing seller control.
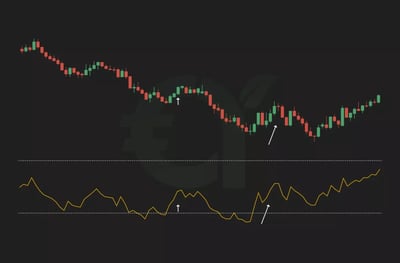
What is RSI in swing trading?
RSI, or Relative Strength Index, is a momentum indicator that helps traders tell whether an asset is oversold or overbought. It does this by measuring the magnitude of recent price changes. Swing traders use it to gauge momentum and possible reversal conditions.
As a momentum oscillator, it may be found under the category of “oscillators” on your chart, i.e., a line graph that moves between two extremes and can range between zero and 100. It calculates the magnitude of the latest price changes. The RSI line ascends when the number and size of bullish closes go up. Likewise, it declines when the magnitude of losses increases.
The most straightforward RSI signal occurs when the indicator breaks above the 70 levels; it suggests an overbought level and might anticipate an uptrend’s reversal. However, if the RSI enters the zone below the 30 mark, then it indicates an oversold market, meaning the bearish trend could end soon.
One mistake I see frequently when reviewing swing setups is treating RSI above 70 or below 30 as an automatic reversal signal, when in strong trends the indicator can stay stretched for several sessions before price actually turns.
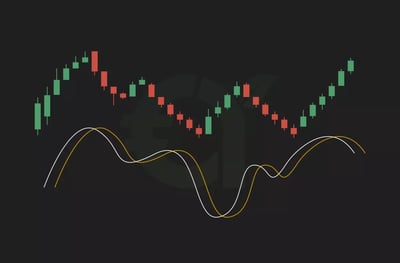
What is the Stochastic Oscillator?
The Stochastic Oscillator is a momentum indicator that works similarly to the RSI, although it uses different calculations. Like RSI, it is read on a zero-to-100 scale. Its common overbought and oversold levels are 80 and 20, respectively.
Instead of a single line on a chart, you will have two. The first, of course, is the stochastic oscillator. The other is a three-day MA. Why? When the two lines close in on each other and end up crossing, it indicates a reversal is coming.
What are the best swing trading tools to use?
Though these trading indicators provide relevant signals, they are more effective when combined with other charting tools. Here are the most important ones:
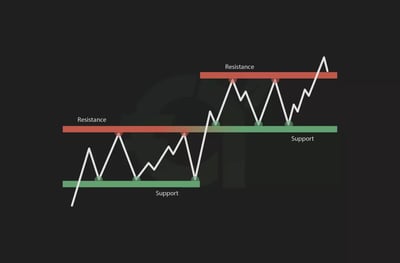
Support and resistance lines
A swing trader should always operate with support and resistance lines because these are the most relevant when determining an asset’s price range. In other words, the resistance level is an imaginary line that the price finds challenging to break and usually pulls back. While the support level is an imaginary line made of recent lows, which shows the price stops declining and bounces back. If there is a breakout within these lines, the price usually moves in the breakout direction.
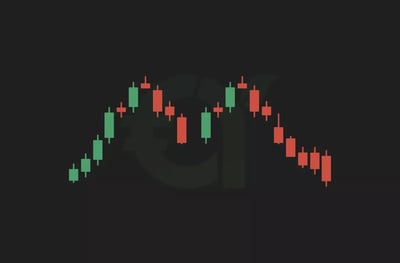
What are chart patterns in swing trading?
chart patterns in swing trading are recurring formations on candlestick charts that help traders interpret possible market moves. Swing traders use them to identify setups and better understand price behavior. These patterns generally fall into two main categories.
Trend continuation patterns, which anticipate the continuation of a trend. Some examples are triangles, rectangles, flags and pennants.
Trend reversal patterns, which signal the reversal of a trend. Some examples are double tops or bottoms, as well as head and shoulders.
Conclusion
Indicators for swing trading can make a real difference when you are trying to identify opportunities, manage risk, and trade with more consistency. For beginners especially, swing trading offers a more flexible approach than day trading, but success still depends on understanding how these tools actually work.
No indicator is perfect, and none can predict the market with complete accuracy. What they can do is help you make better-informed decisions when combined with discipline and basic risk management, including the use of a stop-loss. Learn them well, test them carefully, and use them to build a strategy that fits your goals.
FAQ
The eight types of indicators for swing trading are MA, SMA, EMA, Volume, Bollinger Bands, Ease of Movement, RSI, and Stochastic Oscillator. They can be used individually, but work best when used in conjunction to provide a holistic picture of your asset’s behavior over time.
There is no single best indicator. In this article, moving averages help confirm trend, RSI and Stochastic measure momentum, and Volume strengthens breakout signals, so using several tools together is usually more reliable than depending on one.
Swing traders usually hold positions for hours, days, or weeks, so the best time frame depends on your market and strategy. The article stresses using a timeframe that helps you track meaningful swings rather than short-term noise.
The core indicators covered here are MA, SMA, EMA, Volume, Bollinger Bands, Ease of Movement, RSI, and the Stochastic Oscillator. They work best when combined to read trend, momentum, volatility, and trade strength together.
RSI helps you spot overbought and oversold conditions. In this article, readings above 70 may signal a possible reversal from overbought levels, while readings below 30 can suggest a bearish move is losing strength.
Moving averages smooth short-term volatility and make the broader trend easier to read. The article also notes that a short-term MA crossing above a longer-term MA can be bullish, while the opposite crossover can be bearish.
Volume helps confirm whether a trend or breakout has real strength behind it. According to the article, high volume usually supports stronger price moves, while weak volume can make a breakout or trend less convincing.
Yes. Bollinger Bands can help identify volatility, trend conditions, and possible overbought or oversold areas. The article explains they are also useful in ranging markets, where price often moves back toward the middle band.
Yes, but they still need practice and discipline. The article presents swing trading as more beginner-friendly than day trading, while emphasizing that traders must understand their indicators and apply proper risk management.
Yes. The article explains that swing trading is commonly used in forex and stocks, and can also work with cryptocurrencies. The same indicators can be applied across markets, though volatility and risk may differ.
No. The article makes clear that indicators do not predict future price moves with certainty. Their purpose is to help you interpret trend, momentum, and market conditions so you can make more informed trading decisions.