Table Of Contents
- What is a Moving Average?
- Does Technical Analysis Work in Retail Trading?
- How Does a Moving Average Work?
- Using Moving Averages
- Types of Moving Averages
- Choosing Between SMA and EMA
- How to Calculate Moving Average
- Trading Strategies Using SMA
- Advantages and Disadvantages of Moving Averages
- Live Example: How to Use Moving Averages to Identify Support and Resistance Levels
- How to Use Moving Averages to Measure Momentum
- How to Use Moving Averages to Identify Support and Resistance Levels
- How to Set Take Profit and Stop Loss Using a Moving Average
- How To Use Moving Averages to Identify Trends
- Conclusion
How to Master the Markets with Moving Averages
In my view, as a longtime trader, it’s not an option for regular traders to get access to the same insider information or high-tech tools as institutional traders. To improve their performance, they must rely on their own research and analysis to guide their decisions.
This is where technical analysis plays a crucial role in building strategies. And some of the most highly useful strategies that traders use include moving averages, support and resistance levels, and chart patterns.
The main idea behind technical analysis is that price action tends to follow certain patterns over time, and by recognizing these patterns, you can get a sense of where the market might head next. That’s why I've written this article on moving averages, one of the most important indicators you as a trader can use. Use this article to guide your strategies, but always remember that past performance is no guarantee of future performance.
Moving averages smooth price data over a set period to reveal underlying trends and filter out noise
Simple moving average (SMA) calculates the average closing price over a specific timeframe while exponential moving average (EMA) gives more weight to recent prices
Traders use moving average crossovers—such as a short-term SMA crossing above a longer-term SMA—as signals to enter or exit trades
Support and resistance levels often align with moving averages, making them useful for identifying dynamic entry points and stop levels
Smoothing periods like 20, 50, 100, and 200 are common; each suits different timeframes from intraday to long-term investing
Moving averages can act as trend filters, helping traders avoid false signals during sideways or choppy markets
Combining moving averages with other indicators like RSI MACD or volume trends enhances signal accuracy and provides confirmation
Effective use of moving averages involves backtesting settings on historical data, matching the timeframe to your strategy, and applying risk controls before deploying live
What is a Moving Average?
In my opinion, a moving average is one of the most common and versatile tools in a trader’s toolbox, especially when it comes to understanding market trends. In basic terms, a moving average is a calculation that helps smooth price data over a specific period. What does this mean? Well, the direction of the average gives you an overall understanding of the direction in which a certain price is traveling.
The moving average achieves this by averaging the price of a security—whether that’s a stock, bond, FOREX, or commodity—over a set number of periods, and then plotting that average on a chart. It’s in the name—the average “moves” because it is continually updated as each new data point (like a day’s closing price) comes in.
Rather than looking at the often jagged, unpredictable movement of prices over time, a moving average smooths things out, giving you a clearer picture of the overall trend. If you’re trying to determine whether a stock is on an upward or downward path, moving averages can help cut out the noise caused by short-term fluctuations and focus on the broader direction.
There are different types of moving averages, which I will get to, but for now, just remember that moving averages can help you identify trends and make more-informed trading decisions. Whether you're trying to spot a trend early or confirm a potential reversal, moving averages offer a steady line of support in the unpredictable world of retail trading.
Does Technical Analysis Work in Retail Trading?
In my trading experience, I've found that technical analysis is very important in retail trading. While some traders focus on fundamentals—such as a company’s earnings, management, and economic factors—technical analysis focuses on price action itself. This is where, as a trader, you study past price data, volume, and various indicators to predict future market behavior.
Technical analysis is appealing to retail traders because it doesn’t require you to know every detail about a company’s financial health or the broader economic outlook. Instead, it focuses on the psychology of the market—how buyers and sellers interact—and breaks that down into trends and signals. This is where tools like candlestick charts, moving averages, and momentum indicators come into play, helping you decide when to enter or exit trades.
At its core, technical analysis is all about timing. For retail traders, good timing can mean the difference between making the most of a positive trend or getting caught in a losing trade. Remember, no analysis method is foolproof. However, mastering the basics of technical analysis allows you to level the playing field, make educated guesses about market direction, and sharpen your trading strategies. If you want to read about detailed trading plans, go here.
How Does a Moving Average Work?
As I’ve already said, a moving average smooths a security's price data over a set period, giving you a clearer view of trends and reducing the impact of short-term volatility. Essentially, it calculates the average price of a security over a specified number of time periods and updates it as each new data point arrives. This process creates a “moving” line on a price chart that helps you see the market's general direction without being distracted by day-to-day price fluctuations.
Here’s an easy breakdown of how a Simple Moving Average (SMA) works: Let’s say you want to calculate the 10-day moving average of a stock. You take the closing price of the stock for the past 10 days, add them up, and then divide that total by 10. This gives you the average price for those 10 days.
Now, on the next day, the moving average creeps forward, removing the price of day one and adding the new day’s price to the calculation. This creates a continuous, updated average.
On the other hand, an Exponential Moving Average (EMA) works a little differently. While the SMA gives equal weight to all the data points in the period, the EMA places more weight on recent prices. This makes the EMA more responsive to the most recent price changes, which can be useful when you are looking to capture short-term market movements.
Moving averages are typically plotted on a price chart and can act as dynamic support or resistance levels. For instance, in an uptrend, a stock’s price might pull back to its moving average and then bounce higher. Traders use these moments to decide when to enter or exit a trade.
Identifying crossovers, the holy grail in technical analysis
Ultimately, all this analysis must lead to something. One of the most popular uses of moving averages is to identify crossovers. A crossover in technical analysis is a trading signal that occurs when one technical indicator crosses another. The most common type of crossover involves moving averages, where a shorter-term moving average crosses above or below a longer-term moving average, providing potential buy or sell signals.
Types of crossovers
There are two main types of crossovers:
Bullish crossover (Golden cross): This occurs when a shorter-term moving average (e.g., 50-day SMA) crosses above a longer-term moving average (e.g., 200-day SMA). A golden cross signals a potential uptrend and is typically seen as a bullish sign, indicating that momentum is shifting in favor of buyers.
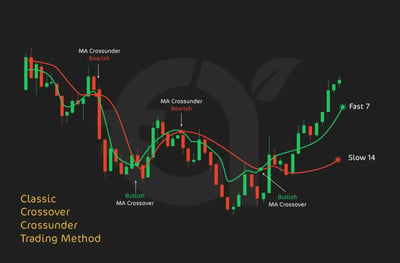
Bearish crossover (Death cross): This happens when a shorter-term moving average crosses below a longer-term moving average. Known as the death cross, this indicates a potential downtrend and is viewed as a bearish signal, suggesting that sellers are gaining control. In the following image, we can see examples of both bullish and bearish crossovers.
Importance of crossovers
Crossovers are important because they give you a visual cue to enter or exit trades. They help confirm trend reversals or continuations and are widely used in strategies that focus on trend-following.
For example, when a short-term moving average crosses above a longer-term moving average (like the 50-day moving above the 200-day), it can signal the start of an uptrend, or a golden cross. Conversely, when a shorter moving average crosses below a longer one, it’s often a signal of a downtrend, or a death cross.
Using Moving Averages
Now that we understand what moving averages are about, what is the best way of using them to our trading advantage?
What is the best way to use moving averages?
In my view, the best way to use moving averages depends on your trading goals, style, and timeframe. Here are a few practical ways to make the most of moving averages:
1. Trend identification: One of the easiest and most effective uses of moving averages is to identify the overall trend of the security you are trading. If the price often trades above a moving average, you could be looking at an upward trend. On the other hand, if the price is below the moving average, it’s likely to be a downward trend. This helps you stay on the right side of the market.
2. Crossover strategies: A lot of traders use moving average crossovers as signals for entering or exiting trades. For example, a popular strategy is the golden cross, in which a short-term moving average (such as the 50-day) crosses above a long-term moving average (such as the 200-day). This is often seen as a bullish signal. The death cross, where a short-term average crosses below a long-term average, is a bearish signal.
3. Support and resistance: Moving averages can also act as dynamic support or resistance. In an uptrend, the moving average can act as a level where the price might pull back before continuing higher. Then, it might act as a resistance level in a downtrend where the price struggles to break above.
4. Multiple moving averages: Some traders use multiple moving averages to understand the market's strength better. If you think about it, a combination of the 10-day, 50-day, and 200-day moving averages on the same chart can provide insights into short-, medium-, and long-term trends.
What is lag factor in moving averages?
The lag factor in moving averages refers to the delay in a moving average's response to price changes. Because a moving average is calculated from past prices, it reacts to price movements with a delay. The longer the moving average period, the greater the lag. For instance, a 200-day moving average will take longer to reflect changes in price trends than a 20-day moving average, which reacts more quickly to price fluctuations.
This lag can be both a pro and a con. On one hand, the lag helps smooth out short-term noise and provides a clearer picture of the overall trend. On the other hand, because it reacts slowly, traders can enter or exit trades later than they would with more reactive indicators. It just depends on which one you are comfortable with.
Take this example: in a fast-moving market, by the time a moving average crossover signals an uptrend or downtrend, a significant part of the move may have already occurred. To address this, traders sometimes use EMAs, which are more responsive to recent price changes and lag less than SMAs.
For a trader looking to make the most of moving indicators, understanding the lag factor is essential, as it reminds us that while moving averages are great for identifying trends, they might not always be on the money for short-term price action. This is why many traders use them in combination with other technical indicators to make better decisions.
Types of Moving Averages
I’ve introduced you to the two main types of moving averages, but let’s delve deeper.
Simple moving average
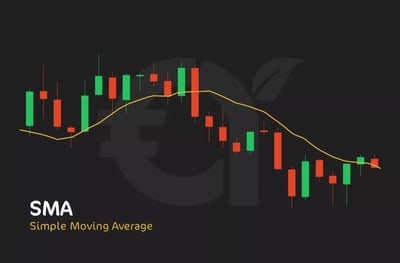
The SMA is the most straightforward type of moving average. It calculates the average price over a specific time period and gives equal weight to all data points within that period. This makes it a great tool for smoothing out short-term fluctuations and providing a clearer picture of the overall market trend.
For example, a 10-day SMA takes the closing prices from the last 10 days, sums them, and divides by 10 to get an average. This process repeats every day, removing the oldest price and adding the most recent price, so the average “moves” over time.
The most popular types of simple moving averages by time period—SMA
Traders use different SMA time periods based on their trading style and goals. Some of the most commonly used SMAs include:
10-day SMA: Ideal for short-term traders who want to track immediate price movements. This period is often used by day traders or swing traders looking for quick-trend identification.
50-day SMA: Frequently used by intermediate traders. It gives a broader view of the market and helps filter out some of the shorter-term noise while still providing timely signals for trend changes.
200-day SMA: A favorite among long-term investors, the 200-day SMA is often considered a strong indicator of the market’s overall health. When the price is above the 200-day SMA, it’s generally seen as a bullish signal, while prices below it can indicate bearish sentiment.
These time periods are not set in stone, and traders often tweak them to fit their individual strategies. However, the 50-day and 200-day SMAs are particularly influential, with many traders paying attention to crossovers between these two lines as key signals.
Exponential moving average
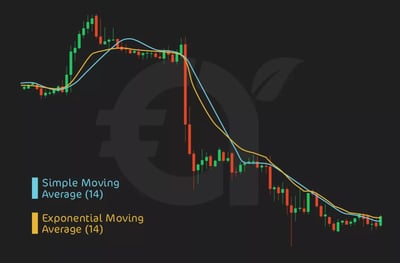
The EMA works similarly to the SMA but places more weight on recent price data, making it more responsive to current market conditions. The EMA reacts faster to price changes, which can be useful for traders who want to capture short-term price moves or who trade in volatile markets.
For instance, a 10-day EMA will respond more quickly to price fluctuations than a 10-day SMA, making it a better fit for traders who want to react swiftly to changes in trend direction. This makes the EMA particularly useful for day traders or anyone operating on shorter timeframes. The key difference here is that the EMA is designed to reduce lag, which is the delay between when a price movement happens and when the moving average reflects it.
The most popular types of simple moving averages by time period—EMA
Traders use different EMA time periods depending on their trading style and objectives. Some of the most commonly used EMAs include:
10-day EMA: Ideal for short-term traders who want to capture immediate price movements. This period is popular among day traders and swing traders seeking quick trend signals, as the EMA places more weight on recent prices and thus making it more responsive than the SMA.
50-day EMA: Frequently used by intermediate traders. It offers a broader view of the market while still being sensitive enough to capture meaningful trend shifts. The 50-day EMA filters out some short-term market noise, giving clearer signals for medium-term trading strategies.
200-day EMA: A preferred choice for long-term investors, the 200-day EMA is a widely followed indicator of the market’s overall trend. When the price remains above the 200-day EMA, it’s typically seen as a bullish signal, while prices below this line suggest bearish sentiment.
Choosing Between SMA and EMA
While both moving averages serve similar purposes, the choice between them depends on your trading style:
SMA is best for smoothing out noise and getting a clearer picture of long-term trends.
EMA is ideal when you need faster signals and want to react to more recent price movements.
Both types of moving averages are valuable in retail trading, and many traders use them together to confirm trends and make more informed decisions. Understanding how they work and choosing the right time period will help you refine your strategy and increase your chances of success.
How to Calculate Moving Average
Calculating a moving average is easy enough, but the type of moving average you choose (Simple or Exponential) will affect how the calculation is done. Here’s a breakdown of how to calculate both the SMA and the EMA:
SMA
The Simple Moving Average is the easiest to calculate. It’s nothing more than the average of the price of a security over a specific number of periods. Here’s how to do it:
- Step 1: Choose the time period you want to use (e.g., 10 days, 20 days, etc.).
- Step 2: Add the closing prices for the number of periods you’ve chosen.
- Step 3: Divide the total by the number of periods to get the average.
Example: Calculating a 5-day SMA
Let’s say you want to calculate the 5-day SMA for a stock, and the closing prices for the last 5 days are:
Day 1: $100
Day 2: $105
Day 3: $110
Day 4: $115
Day 5: $120
- Add the prices together: 100 + 105 + 110 + 115 + 120 = 550
- Divide the total by the number of days (5): 550 ÷ 5 = $110
So, the 5-day simple moving average is $110.
EMA
The EMA is a bit more complex because it gives more weight to recent prices. This makes it more responsive to recent price changes than the SMA.
Here’s the formula for EMA:
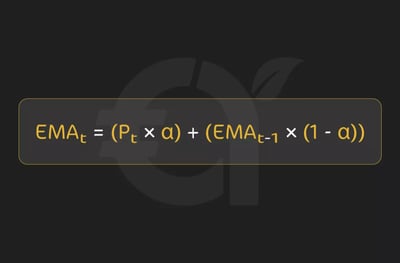
Steps to calculate EMA:
Choose the number of periods (n) for the EMA
Calculate the smoothing factor (\alpha)
Apply the EMA formula starting with the SMA for the first EMA calculation (as a baseline), and then use the EMA formula for subsequent periods
Note that the formula gives more weight to recent prices, making the EMA more responsive to current market conditions than the SMA.
Example: Calculating a 10-day EMA
1. Step 1: Calculate the 10-day SMA as your starting point.
2. Step 2: Find the smoothing factor for a 10-day EMA
3. Step 3: Take the current price, subtract the previous EMA (which starts with the SMA), and multiply the result by the smoothing factor. Then add the previous EMA to get the new EMA.
Look at it this way: if the previous EMA was $110 and today’s closing price is $115, the new EMA would be approximately $110.91.
These calculations are good to know. It’s even better if you know how to work them yourself. However, as I’ve said, most broker platforms will calculate it for you.
Trading Strategies Using SMA
As a longtime trader, I've seen that one of the most popular trading strategies involving the SMA is the SMA crossover strategy. This strategy is simple yet effective for identifying potential buy and sell signals by analyzing the interaction between different moving averages. In its essence, it involves using two SMAs of different time periods (a shorter and a longer one) and trading when they "cross over" each other.Consider the graphic below; we can see that when the price crosses the SMA line, the price often trends upward for a while. This is often used as a buy signal for technical traders. However, when the price crosses and dips below the SMA line, we also see a slightly bearish price trend. This can sometimes be a good signal to sell. However, you should be careful when timing crossovers, as the SMA is based on historical data and lags real-time data.
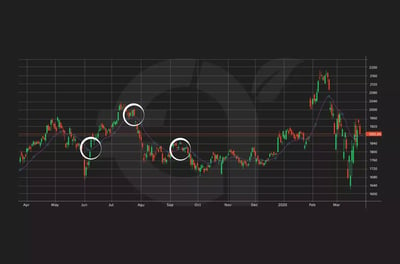
Buy and sell on SMA crossovers
The idea behind SMA crossovers is straightforward: when a shorter-term SMA crosses above a longer-term SMA, it indicates a potential bullish trend (buy signal), and when it crosses below, it signals a bearish trend (sell signal). These crossovers help traders spot changes in momentum and decide when to enter or exit a position.
SMA crossover strategy
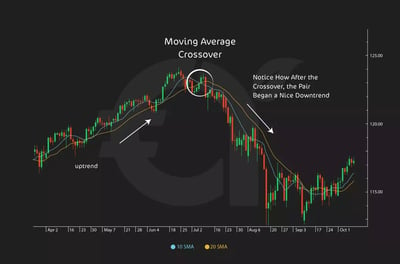
The SMA crossover strategy typically uses two SMAs: one shorter-term and one longer-term. The shorter-term SMA is more sensitive to price changes and gives quicker signals, while the longer-term SMA helps confirm the broader trend and filters out false signals. This is borne out in the graphic below. Study the 10-day (purple) and 20-day (green) SMA lines, you will see that when the 10-day line first crosses above the 20-day line, the trader who bought the stock would ideally have profited from the two-month upward trend. If the trader sold it correctly when the 10-day line crossed below the 20-day line, they would have exited their position two months ahead of the overall downtrend.
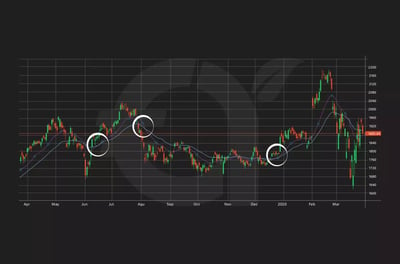
Let’s look at the details of these signals:
Bullish crossover
A bullish crossover occurs when the shorter-term SMA crosses above the longer-term SMA. This crossover is often seen as a signal that momentum is shifting upward, and a new uptrend could be forming. In this scenario, traders would typically look to buy the asset, anticipating further price increases.
For example, if you use a 50-day SMA and a 200-day SMA, a bullish crossover happens when the 50-day SMA crosses above the 200-day SMA, signaling a potential golden cross.
Bearish crossover
A bearish crossover happens when the shorter-term SMA crosses below the longer-term SMA. This suggests that the asset's momentum is turning negative, and a downtrend may be forming. In this case, traders would typically look to sell or short the asset to profit from falling prices.
Using the same 50-day and 200-day SMA example, a bearish crossover occurs when the 50-day SMA crosses below the 200-day SMA. This death cross signals a potential downtrend and a bearish sentiment in the market.
Moving average crossover
The moving average crossover strategy can be applied to different timeframes, including the H4 (4-hour) chart, which is popular among traders who want to strike a balance between short-term and long-term trading. Here’s how you can apply it on the H4 chart
1. Select two SMAs: For example, use a 50-period and a 200-period SMA on the 4-hour chart.
2. Identify the Crossover: Wait for the shorter SMA (50-period) to cross either above or below the longer SMA (200-period).
3. Execute the Trade:
- Buy when the shorter SMA crosses above the longer one (bullish crossover).
- Sell or short when the shorter SMA crosses below the longer one (bearish crossover)
4. Confirm with Additional Indicators: While the crossover is a powerful signal, you might want to confirm it with such other indicators as the Relative Strength Index (RSI) or Moving Average Convergence Divergence (MACD) to avoid false signals, especially in choppy markets.
Fine-tuning the strategy
While SMA crossovers can be a great tool for beginners, it's important to remember that they work best in trending markets and may give false signals during sideways or choppy conditions. To improve your strategy, you can:
- Adjust the timeframes based on your trading style. For example, day traders might use shorter periods like 10-day and 50-day SMAs, while long-term traders might stick to 50-day and 200-day SMAs.
- Use stop-loss orders to protect yourself from potential reversals after a crossover, ensuring you don’t lose more than you can afford.
From what we’ve seen, the SMA crossover strategy is a time-tested method for identifying potential buy and sell opportunities by tracking the relationship between short-term and long-term moving averages. It’s a versatile strategy that can be applied to various timeframes, including the H4 chart, making it a go-to for both beginner and intermediate retail traders.
Advantages and Disadvantages of Moving Averages
I would say that, like all trading tools, they are not foolproof, and you should use them with caution and in conjunction with each other. Here are some of the pros and cons of moving averages.
Advantages of moving averages
Trend identification: Moving averages are excellent tools for determining trend direction. By smoothing out price data, they help traders focus on the overall movement, whether it’s an upward or downward trend, and eliminate the noise caused by short-term fluctuations.
Simple and easy to use: Moving averages are straightforward to understand and apply, making them ideal for beginner traders. They can be easily plotted on any chart, and their signals, such as crossovers, are easy to interpret.
Dynamic support and resistance: Moving averages can act as both. For example, during an uptrend, the price may pull back to the moving average before resuming its upward trajectory, offering potential entry points for traders.
Works across different timeframes: Moving averages can be used on various timeframes, from minute-by-minute charts for day traders to daily, weekly, or even monthly charts for long-term traders. This flexibility makes moving averages a valuable tool regardless of your trading style.
Versatile: Moving averages can be applied to almost any financial instrument, including stocks, FOREX, commodities, and cryptocurrencies. They are also useful for different market conditions, helping traders adapt their strategies based on the price trend
Useful in conjunction with other indicators: Moving averages work well when combined with indicators such as the RSI or MACD, providing more robust trading signals.
Disadvantages of moving averages
Lagging indicator: One of the biggest drawbacks of moving averages is that they lag, meaning they rely on past price data. As a result, they react slowly to sudden price movements. This delay can cause traders to enter or exit trades later than they would with more responsive indicators.
Not effective in sideways markets: Moving averages tend to perform poorly in sideways or range-bound markets. In such conditions, they can produce false signals, causing traders to buy or sell when there is no strong trend. This can lead to unnecessary losses or missed opportunities.
Potential for false signals: In volatile markets, moving averages can produce false signals due to short-term price fluctuations. Traders might experience “whipsaws,” where prices oscillate around the moving average, generating inaccurate buy or sell signals.
Limited predictive power: While moving averages help identify trends, they don’t predict future price movements. They only show the average market direction based on historical data, so traders must combine them with other tools to gain a clearer picture of potential market behavior.
Choice of time period can affect accuracy: The effectiveness of a moving average depends heavily on the chosen time period. A shorter moving average might react too quickly and generate too many signals, while a longer moving average might be too slow, leading to delayed reactions. Finding the right balance requires experience and adjustments depending on market conditions.
Does not work well for all assets: While moving averages are useful for many assets, they might not work as well for extremely volatile or illiquid securities. The lag and potential for false signals become more pronounced in such markets.
Live Example: How to Use Moving Averages to Identify Support and Resistance Levels
Moving averages can serve as dynamic support and resistance levels, providing traders with key zones where the price may react. Here’s a step-by-step example of how you could use moving averages, such as the 50-day and 200-day SMAs, to identify these levels and make trading decisions.
Example scenario: AmazonLet’s say you’re looking at Amazon stock, which is currently in an uptrend. You apply a 50-day SMA to the chart and notice that the stock price has been consistently above it for the past few months. In the graphic below, the 50-day SMA is represented by a line that indicates the general direction of price movement. Here’s how you would use the moving average as a support level:
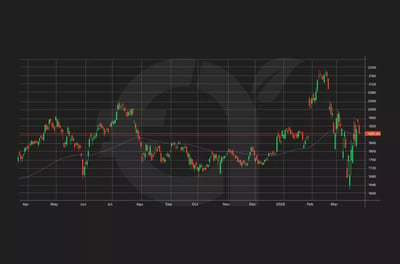
Step 1: Identify an uptrend and apply the moving average
You see that Amazon is in an uptrend, and you plot the 50-day SMA on the chart. The price has pulled back several times to the 50-day SMA but has rebounded each time, showing that the moving average is acting as a dynamic support level.
Step 2: Watch for pullbacks to the moving average
As Amazon continues its uptrend, you wait for the next pullback to the 50-day SMA. The idea is that the moving average will act as a support level, where buyers might step in to push the price higher again. You observe that whenever the price approaches the 50-day SMA, it bounces off and resumes its upward move. This is a strong indication that the moving average is providing support.
Step 3: Plan your entry
You can use this moving average support as an opportunity to enter a trade. When the price pulls back to the 50-day SMA, you could place a buy order, anticipating that the price will bounce higher as it has done in the past. If Amazon bounces off the 50-day SMA again, it confirms that the moving average is acting as support, giving you confidence in your trade.
In the following chart, a 10-day SMA was used. Since the SMA line was calculated based only on the stock price for the previous 10 days, the line follows price changes much more closely than the 50-day SMA shown in the previous chart.
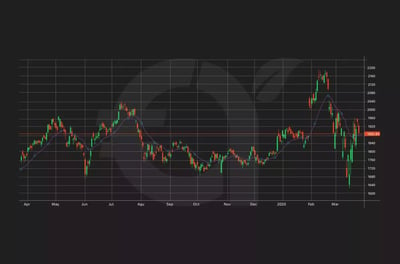
Step 4: Setting stop loss and taking profits
You can set a stop-loss slightly below the 50-day SMA to protect your trade in case the price breaks below the moving average, indicating that the trend may be weakening. Your profit target can be set based on recent highs or key resistance levels above the current price.
Step 5: Look for resistance using a longer-term moving average
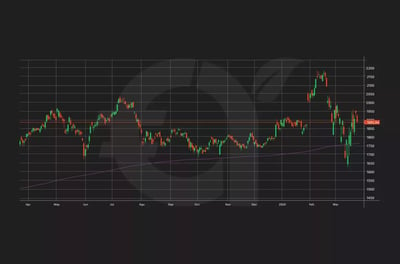
Now, let’s assume Amazon continues to rise and approaches the 200-day SMA, which often acts as a key resistance level in long-term uptrends. In the following chart, a 200-day simple moving average has been used. Since the line represents the average of the closing prices for the previous 200 days, the line is smoother and is not easily affected by price fluctuations.As the price approaches the 200-day SMA, you start watching for signs of resistance—perhaps the price starts to stall, or there are repeated rejections at that level. This could be an indication that the stock is struggling to break above the longer-term resistance level.
Step 6: Plan your exit or short position
If the price repeatedly fails to break above the 200-day SMA, you might consider exiting your long position or even placing a short trade, expecting the price to pull back from this resistance level. Again, you can use stop-loss orders just above the 200-day SMA to protect your position if the price breaks out unexpectedly.
In this example, we used the 50-day SMA as a support level during an uptrend, waiting for price pullbacks to enter trades and ride the trend higher. Then, we monitored the 200-day SMA as a resistance level, watching for signs that the price may struggle to break through. By using moving averages to identify these dynamic support and resistance levels, you can time your trades more effectively and manage your risk with strategic stop-loss and take-profit levels.
This approach works well across different markets and timeframes, whether you're trading stocks, FOREX, or commodities. The key is to watch how the price reacts to these moving averages over time and use them as part of your broader trading strategy.
How to Use Moving Averages to Measure Momentum
I would stress that moving averages are not just useful for identifying trends. They can also help traders measure momentum, which refers to the strength and speed of price movements. By analyzing the relationship between shorter-term and longer-term moving averages, you can gauge whether the momentum is building (positive) or fading (negative). Let's go through a live example using the 50-day and 200-day SMAs to measure a stock's momentum.
Example scenario: MicrosoftYou are tracking Microsoft, which has been in an uptrend, and you want to use moving averages to determine whether the upward momentum is continuing or starting to fade. You apply both the 50-day SMA and the 200-day SMA on your chart.
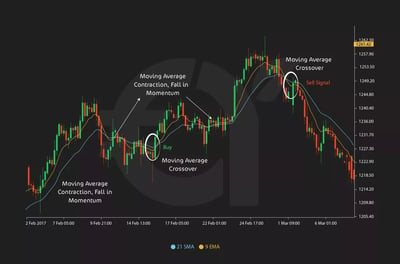
Step 1: Look for crossovers
The first step is looking for a moving average crossover, a classic signal for measuring momentum. The graphic above shows an example of how this could look. Specifically, you are watching for the 50-day SMA (shorter-term) to cross over the 200-day SMA (longer-term).
Bullish momentum: If the 50-day SMA crosses above the 200-day SMA, this is called a golden cross. It indicates that momentum is building, and the uptrend is gaining strength. This crossover suggests that recent prices are trending higher than they have over a longer period, a clear signal of positive momentum.
Bearish momentum: If the 50-day SMA crosses below the 200-day SMA, this is known as a death cross. It signals that momentum is weakening, and the stock may be heading into a downtrend. The recent price movement is no longer strong enough to support the longer-term trend.
Step 2: Confirm momentum strength
Once the crossover occurs, you can further confirm the strength of the momentum by analyzing the distance between the two moving averages.
Expanding distance: If the distance between the 50-day and 200-day SMAs continues to expand after the crossover, this indicates that momentum is strong and increasing. In the case of a bullish crossover, the price is rising quickly, pushing the shorter moving average further away from the longer one.
Narrowing distance: On the other hand, if the distance between the moving averages begins to narrow after a crossover, it may signal that momentum is fading. The price is either not rising or is falling as fast as before, suggesting that the strength of the current trend is weakening.
Step 3: Monitor momentum in real time
Assume Microsoft experienced a golden cross, with the 50-day SMA crossing above the 200-day SMA. You notice that the distance between the two moving averages is increasing, confirming that momentum is accelerating. This is a good sign that the stock is gaining strength, and you may decide to hold your position or even enter a new trade.
If you see the price rising sharply, you can infer that buyers are stepping in with force, which reinforces the upward momentum. You may also notice higher volume during this period, another indication that the stock has strong momentum behind it.
Step 4: Spot momentum loss and prepare an exit
Now, let’s fast forward a few weeks. You begin to notice that the price of Microsoft is not rising as quickly as before. The distance between the 50-day and 200-day SMAs is starting to narrow, and the stock price is moving sideways. This narrowing of the gap between the two moving averages signals that momentum is slowing down.
At this point, you might consider locking in profits if you were holding a long position. If the 50-day SMA starts to move toward the 200-day SMA again, it could signal a possible reversal in momentum, warning you that the stock might be losing its upward strength.
Step 5: Exit or reverse strategy
If the 50-day SMA crosses below the 200-day SMA (death cross), this is a clear sign that momentum has shifted to the downside. You could consider exiting your long position entirely, or, if you are a more aggressive trader, you might even consider taking a short position, betting that Microsoft is now headed for a downtrend with negative momentum.
In this example, we used the relationship between the 50-day and 200-day SMAs to measure momentum:
- A golden cross signals the beginning of bullish momentum.
- The distance between the moving averages indicates the strength of that momentum.
- A narrowing gap or a death cross signals fading or reversing momentum.
By observing these crossovers and the behavior of the moving averages, you can assess whether momentum is building or waning, helping you make better-informed trading decisions.
How to Use Moving Averages to Identify Support and Resistance Levels
Moving averages can also act as support in an uptrend and resistance in a downtrend. A short-term uptrend may find support near the 20-day simple moving average, which is also used in the Bollinger Bands indicator. A long-term uptrend may find support near the 200-day simple moving average, which is the most common long-term moving average. The 200-day moving average can offer support or resistance because it is so widely used.
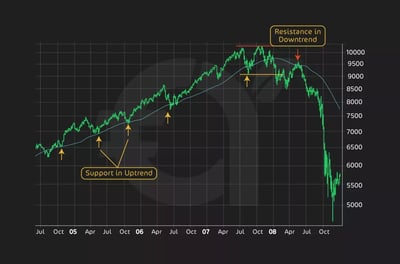
The chart above shows the New York Composite Index with the 200-day SMA from mid-2004 through late 2008. The 200-day SMA provided support several times during the advance. Once the trend reversed with the break of the double top support, the 200-day SMA acted as resistance around the 9500 level.
How to Set Take Profit and Stop Loss Using a Moving Average
Using moving averages for setting take-profit and stop-loss levels is a great strategy for risk management and locking in profits. Here's how you can do this effectively:
Step 1: Setting a stop loss with a moving average
A stop loss is an order placed to sell a security when it reaches a certain price, designed to limit potential losses. When using a moving average, the stop loss level is typically set just below the moving average in an uptrend (for long positions) or above the moving average in a downtrend (for short positions). This ensures that the stop loss will trigger and protect you from further losses if the price moves against your position and breaks the moving average.
Example for long positions:
- You are using a 50-day SMA as part of your trading strategy on a stock such as Amazon, which is currently in an uptrend.
- You enter a long position when the stock pulls back to the 50-day SMA, expecting the moving average to act as support.
- To protect your trade, you set your stop loss just below the 50-day SMA, say 2-3% below the moving average. This means if the price drops significantly below the moving average, indicating that the trend might be reversing, your stop loss will sell the stock to prevent further losses.
Example for short positions:- For short positions in a downtrend, you would place your stop loss just above the moving average. For instance, if you enter a short trade as the price nears a 200-day SMA, your stop loss should be slightly above that level to protect against a breakout to the upside.
Step 2: Setting a take profit with a moving average
A take-profit order is used to automatically close your position once a certain profit target is reached. With moving averages, take-profit levels can be set using several techniques.
Method 1: Using a longer-term moving average as the take-profit target
You might be using a shorter-term moving average (like the 20-day SMA) to enter the trade, but your take-profit level can be based on a longer-term moving average (like the 200-day SMA). In this case, you would exit the trade when the price approaches or breaks the longer-term moving average, which could act as resistance in an uptrend or support in a downtrend.
Method 2: Using dynamic trailing stop with a moving average
Another approach is to use the moving average itself as a dynamic take profit level by trailing the stop loss as the price moves in your favor. For example, if you’re using the 50-day SMA in an uptrend, you can continually adjust your stop loss to just below the moving average as the price moves higher. This way, if the price eventually breaks below the moving average, you can lock in profits while allowing the trade to develop.
Example for long positions:
You bought Amazon when the price bounced off the 50-day SMA at $100, and the stock price has now risen to $120.
Rather than setting a fixed take-profit target, you could allow the stock to continue rising by trailing your stop loss along with the moving average. Each day, as the price rises and the moving average shifts upward, you adjust your stop loss just below the 50-day SMA.
If the stock reverses and drops below the moving average, your trailing stop would automatically close the position, locking in your profits.
Step 3: Combining moving averages with other indicators
To improve the accuracy of your take-profit and stop-loss settings, you can combine moving averages with other technical indicators like the RSI or Bollinger Bands. For instance, if the price reaches a moving average and the RSI shows that the stock is overbought, it might be a good signal to set a take profit near the moving average resistance level.
Alternatively, if you see that the price is approaching a moving average but volatility (measured by Bollinger Bands) is increasing, you might set a wider stop loss to allow for market fluctuations while still protecting your position.
Here are the main points of what we’ve learned.
Stop loss: Place your stop loss just below the moving average in an uptrend (for long positions) or above the moving average in a downtrend (for short positions). This protects you if the trend reverses.
Take profit: Set your take profit level using a longer-term moving average or use a trailing stop loss based on the moving average to lock in profits as the price continues in your favor.
Dynamic approach: By trailing your stop loss along with the moving average, you allow the trade to maximize potential gains while maintaining risk control.
This strategy helps you capture profits when the trend is strong and limit losses if the price moves against you.
How to use moving averages to identify trends
Moving averages are one of the most effective tools for identifying trends in the market, helping traders smooth out price fluctuations and focus on the bigger picture. By analyzing the position and direction of a moving average over time, you can determine whether a market is in an uptrend, downtrend, or moving sideways.
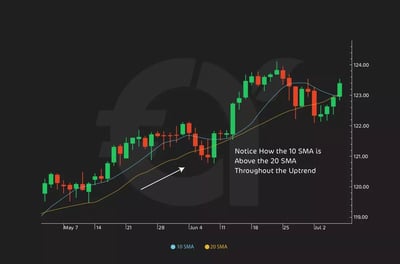
How To Use Moving Averages to Identify Trends
1. Using a single moving average to identify trend direction
The simplest way to use a moving average to identify a trend is by looking at the relationship between the price and the moving average line.
Uptrend: If the price is consistently trading above the moving average, it signals that the market is in an uptrend. The trend is considered strong as long as the price remains above the moving average. The moving average acts as a support level, and traders may look for buying opportunities when the price pulls back to the moving average and bounces higher.
Downtrend: If the price is consistently trading below the moving average, the market is in a downtrend. In this case, the moving average serves as resistance, and traders may look for selling opportunities when the price retraces toward the moving average and then falls again.
Sideways trend: When the price fluctuates around the moving average without a clear direction (i.e., it crosses above and below the moving average frequently), the market is likely in a sideways or range-bound phase, and there is no strong trend.
Example:
You apply a 50-day SMA to a stock. You notice that the stock's price has been consistently above the 50-day SMA for several weeks. This indicates that the stock is in an uptrend. You might then look for opportunities to buy the stock, especially if the price pulls back to the 50-day SMA but bounces higher.
2. Using two moving averages to confirm trends (Crossover strategy)
A common technique to identify trends with moving averages is the crossover strategy, where two moving averages of different time periods are used to confirm trend direction. This strategy involves a shorter-term moving average and a longer-term moving average.
Bullish trend: When the shorter-term moving average (e.g., 50-day SMA) crosses above the longer-term moving average (e.g., 200-day SMA), it is a strong signal of an emerging uptrend. This golden cross indicates that recent price momentum is strong enough to push the market higher.
Bearish trend: When the shorter-term moving average crosses below the longer-term moving average, it signals the beginning of a death cross and suggests that recent price action is weaker than the longer-term trend.
Example:
You apply a 50-day SMA and a 200-day SMA on a stock chart. If the 50-day SMA crosses above the 200-day SMA, it's a bullish signal indicating a possible upward trend. Conversely, if the 50-day SMA crosses below the 200-day SMA, it signals a bearish trend, suggesting the stock might head lower.
3. Using the slope of the moving average to gauge trend strength
The slope or angle of the moving average line can provide insight into the strength of the trend:
- Steeper slope: A sharply rising or falling moving average indicates a strong trend. If the moving average is rising steeply, it confirms that the market is in a strong uptrend. Conversely, a steeply falling moving average confirms a strong downtrend.
- Gentle slope: A gently sloping moving average suggests a weaker trend. The market may be moving in a trend, but with less momentum, which might signal that the trend could change or reverse soon.
Example:
You observe that the 50-day SMA for a stock is rising steeply, showing a strong uptrend. You can confidently say that the market has strong upward momentum. However, if the slope begins to flatten, it could indicate that the trend is losing steam, signaling a possible reversal or consolidation phase.
4. Using multiple moving averages for trend confirmation
Some traders use multiple moving averages (such as 20-day, 50-day, and 200-day SMAs) to confirm the strength and direction of a trend across different timeframes.
Short-term vs long-term trend: A short-term moving average (e.g., 20-day) above a long-term moving average (e.g., 200-day) suggests that the uptrend is strong across both timeframes. If the shorter-term averages cross below the longer-term ones, it indicates a weakening or reversing trend.
Example:
On your stock chart, you have three moving averages: 20-day, 50-day, and 200-day SMAs. You observe that the 20-day SMA is above the 50-day SMA, which is also above the 200-day SMA. This alignment across different timeframes confirms a strong, long-term uptrend.
5. Using moving averages with other indicators
Moving averages can be combined with other indicators, such as the RSI or MACD, to further confirm trends and avoid false signals.
- RSI + Moving average: If the price is above the moving average and the RSI is indicating overbought conditions, you might be cautious about entering a long trade. Conversely, if the price is below the moving average and RSI is in oversold territory, it may signal a buying opportunity.
Example:
The price of a stock is trending above the 50-day SMA, and you notice the RSI is still below 70 (indicating the stock is not yet overbought). This supports the idea of a strong uptrend, and you may decide to enter the trade.
These live examples prove that moving averages are excellent tools for identifying trends. Whether you’re using a single moving average to determine trend direction or multiple moving averages to confirm the strength of the trend, they help provide clarity in an often noisy market.
Conclusion
In my experience as a longtime trader, moving averages are a reliable and versatile tool in retail trading. Just remember that they are not infallible. No tool is. Whether you're just starting out or have some experience under your belt, moving averages can help you better identify trends, measure momentum, and set strategic entry and exit points. By smoothing price fluctuations, moving averages provide clarity in a market often dominated by noise and short-term volatility. While no indicator is foolproof, moving averages can enhance your ability to make informed decisions when used alongside other tools and tailored to your trading style. Embrace them as part of your diversified strategy.
FAQ
A moving average is a technical analysis tool that smooths price data by creating a constantly updated average price over a set period. It helps traders identify trends and reduce the impact of short-term price fluctuations.
To calculate a SMA, sum the closing prices for a selected time period and divide by the number of periods. For example, a 5-day SMA is calculated by adding the closing prices of the last five days and dividing by 5.
The SMA gives equal weight to all data points in a period, while the EMA gives more weight to recent prices, making it more responsive to price changes.
The 10-day, 50-day, and 200-day SMAs are the most popular. Shorter SMAs like the 10-day are used for short-term trends, while longer SMAs, like the 200-day, are used for long-term trends.
A "Golden Cross" occurs when a shorter-term moving average (e.g., a 50-day SMA) crosses above a longer-term moving average (e.g., a 200-day SMA), signaling a potential upward trend.
A "Death Cross" happens when a shorter-term moving average crosses below a longer-term moving average, indicating a potential downtrend.
The lag factor refers to the delay in the moving average’s response to price changes. Longer moving averages (e.g., 200-day SMA) have more lag, while shorter moving averages (e.g., 10-day EMA) respond more quickly to price changes.
Moving averages help traders identify trends by showing whether the price is above or below the moving average. If prices are consistently above the MA, it indicates an uptrend; if below, it indicates a downtrend.
SMA crossovers are trading signals that occur when a shorter-term moving average crosses above or below a longer-term moving average. A bullish crossover signals a potential buy, while a bearish crossover signals a potential sell.
In an uptrend, a moving average can act as a dynamic support level, where prices may pull back before bouncing higher. In a downtrend, it can act as resistance, preventing prices from rising.
Moving averages measure momentum by the distance between a shorter-term and longer-term moving average. An expanding gap suggests strong momentum, while a narrowing gap indicates weakening momentum.
Moving averages help identify trends and smooth price data and are easy to use. They are versatile across different assets and timeframes and can be combined with other indicators for more accurate trading signals.


