Three Top Support and Resistance Trading Methods Explained
Support and resistance are core trading basics that every new trader should understand early. More than simple chart terms, they show where buyers and sellers are most likely to clash, often shaping the next price move.
In this article, I explain what support and resistance are, how these levels act as zones rather than fixed points, and why they matter in technical analysis. You will also see how traders use them to choose entry and exit points, manage risk, and confirm trading signals with more confidence.
Day trading involves buying and selling financial assets within a single trading day to capture short‑term price movements
A small fraction of traders, around 3 percent, achieve profitability and fewer than 1 percent trade consistently with returns
True success often starts with part‑time effort while working another job
Day trading works best with clear strategies focused on risk management, time discipline, and identifying key support and resistance levels
Keeping a trading journal is vital for logging setups, trade rationale, outcomes, and emotional responses to build better patterns
Beginners should start with paper trading to test systems before investing real capital
Choosing the right broker is crucial for factors like execution speed, liquidity, reliability, and access to essential tools
Effective day trading requires ongoing practice, patience, emotional control, and continuous study to refine timing, execution, and resilience
What Are Support and Resistance Levels?
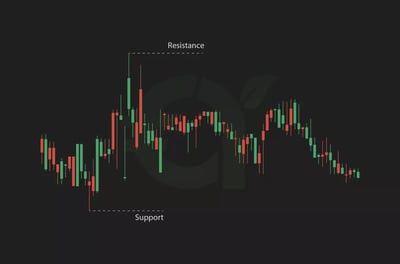
I've learned as a trader that every financial asset has an implied value, and that value oscillates in response to supply and demand, which are driven by sentiment and timing. The support level is the point at which an asset’s price is expected to stop falling after a downtrend due to plentiful supply.
After the price reaches a support level, meaning it has stopped falling, an increase in buyer demand normally pushes the asset value to rise. Resistance levels are reached when demand peaks and the asset’s value rises to the upper end, prompting traders to sell.
Over time, you can take an educated guess about the support and resistance levels of any asset through technical analysis. As you can imagine, it is mightily helpful when you can use this knowledge as the basis of a trading strategy. If used well and fed with quality information, support and resistance trading can be extremely powerful.
Traders normally identify support and resistance levels in a few ways.
- Use this information to judge when to enter or exit a market
- Determine where to insert stops and limits
- Review historical price data to understand previous support and resistance levels
- Study patterns and charts by eye in slow-moving markets, like commodities
- Rely on technical tools in fast-moving markets, like FOREX
In my experience, recently tested support and resistance levels matter most when judging whether current price action may hold, fail, or reverse. This simple method provides a baseline for understanding the asset's behavior over time. As traders become more skilled, they often default to using technical indicators to isolate support and resistance levels, as these technology-enabled signals are faster to generate and more reliable.
In chart reviews we’ve conducted during high-volatility sessions, prior support and resistance zones tended to be more useful when they had been tested multiple times rather than touched only once.

How Do Support and Resistance Levels Work in Trading?
Having reliable information about support and resistance levels gives you a much better feel for how to manage a trade.
- Place stops and limits below support and above resistance levels
- Cut your losses at a pre-defined level
- Accumulate profit with a well-timed take-profit order
- Exit a trade rapidly if the price breaches levels of support or resistance that disadvantage you
Here are three top support and resistance trading strategies:
1. Range Trading
Range trading happens in the predictable space between the support and resistance levels. After using their analysis to quantify these levels, traders try to buy at support levels (the lowest) and sell at resistance levels (the highest). Remember that support and resistance are not always perfectly predictable or straight lines.
- Some markets oscillate within a range and do not always touch the lowest support or the highest resistance levels
- They may bounce up or pull back before you expect or anticipate
- Other markets might briefly break out beyond their established levels before returning within range
Stay in Control of Your Investments
Build and manage your own portfolio with ease.
Track profits, dividends, gainers, and losers in real time.
Create a custom watchlist for the assets you care about most.
Get live updates on stocks, ETFs, cryptos, and commodities.
Access everything anytime through a sleek, flexible dashboard.
.webp)
What Is a Breakout Strategy?
A breakout strategy aims to profit when price moves below support or above resistance and gains momentum in one direction. Traders look for that move to continue as buying or selling pressure builds. The goal is to catch the start of a new trend after the breakout.
However, this risks falling for a false breakout, something many newbie traders do. More experienced traders are good at waiting for a pullback toward a specific support or resistance level before entering a trade. Sometimes waiting for the market to respond before committing is the best approach.
In our observation of breakout setups over the past six months, the weakest entries were usually the ones taken on the first impulsive move without waiting for the retest or for volume to confirm the break.
What Is a Trendline Strategy?
A valid trendline requires at least two significant price points, but the more touches it has, the stronger it is considered.
- Uptrend lines act as dynamic support, guiding prices higher
- Downtrend lines serve as resistance, capping upward movements
- Breakouts above or below a trendline can signal trend reversals or continuations, making them useful for setting stop losses and take-profit targets
Many traders combine trendlines with other indicators, such as moving averages or volume analysis, to confirm trade setups and reduce false signals.
Recommended Brokers


How Are Moving Averages Used as Support and Resistance?
Moving averages can be used as dynamic support and resistance levels to help define a trading range. Traders often apply 20- to 50-period averages on minute or hourly charts to test how price reacts around them. This is a more technical method, and some traders review many averages across set time intervals before relying on their model.
Moving averages can serve as a line of support or resistance. Traders can use these moving averages to make decisions about high-volume, fast-moving markets that may keep trending or break out. If you are placing substantial trades, it makes sense to seek as much detail as possible, but don’t fall into analysis paralysis.
Conclusion
Support and resistance remain some of the most practical trading basics for reading market behavior and making better decisions. Whether you use simple trendlines or more advanced technical tools, the goal is the same: identify key price zones, manage risk wisely, and plan when to enter, exit, stop losses, or take profit.
The real advantage comes from applying these levels consistently. Start practicing them on your charts, test them in different market conditions, and use them to build a more disciplined trading approach.
FAQ
Support is a price zone where a falling market often slows or rebounds because buying interest starts to increase. It is not an exact line, but an area traders use to judge possible entries and risk.
Resistance is a price zone where rising prices often pause or reverse because selling pressure increases. Traders use it to spot possible exits, profit targets, or areas where a breakout may need confirmation.
Traders usually study historical price data, chart patterns, previous swing highs and lows, trendlines, and technical indicators. In faster markets, tools such as moving averages can help confirm levels more quickly and consistently.
No. They are usually zones rather than precise prices. Markets can bounce before reaching them, briefly break through them, or move slightly beyond them before returning, so traders should allow for some flexibility.
When support breaks, it can later act as resistance. When resistance breaks, it can later act as support. Traders often wait for a pullback or confirmation before entering to avoid false breakouts.
They help traders choose entry points, exit points, stop losses, and take-profit targets. A common approach is buying near support or selling near resistance when the broader setup supports the trade idea.
Range trading means buying near support and selling near resistance when price moves inside a defined band. It works best when the market is oscillating rather than trending strongly in one direction.
A breakout strategy aims to trade when price moves beyond support or resistance and starts a stronger directional move. Many traders wait for a pullback after the break to reduce the chance of a false signal.
Yes. Trendlines can create dynamic support or resistance by linking important highs or lows. Moving averages can also act as changing levels that help traders judge trend direction, entries, and possible reversals.
These levels help traders place stop losses and take-profit orders more logically. Using them can define risk before entering a trade and make it easier to exit quickly if price moves against the position.