Table Of Contents
- What are the applications of the Fibonacci sequence?
- What are trading points and retracements?
- How do Fibonacci retracement levels work?
- What Are Fibonacci Retracement levels?
- How can you use Fibonacci Retracement levels?
- How does Fibonacci retracement work in an uptrend?
- How does Fibonacci retracement work in a downtrend?
- The Bottom Line
The Trader’s Guide to Spotting Reversals With Fibonacci Indicators
In the year 1202, an Italian mathematician whose real name was Leonardo of Pisa, but who was better known as Fibonacci, popularized the Fibonacci sequence.
It’s worth pointing out that he did not discover the sequence; that credit goes to Arabic and Indian mathematicians, but he gave it wider exposure through his book Liber Abaci (The Book of Calculation).
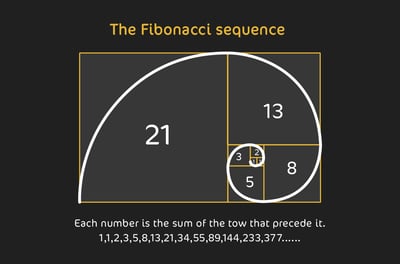
Fundamentally, the Fibonacci sequence is a series of numbers where each number is the sum of the two numbers before it, starting from 0 and 1. It goes 0, 1, 1, 2, 3, 5, 8, 13, 21, and so on.
This sequence forms a ratio also called the “golden ratio” (about 1.618), which can be seen in nature, art, and architecture.
As the numbers increase, the ratio of consecutive numbers approaches the golden ratio, which is believed to represent ideal proportions. Fibonacci proved this in his book using an ingenious example: the reproduction rate of rabbits that showed how populations might grow in predictable patterns, using the Fibonacci sequence.
At this point, you might be wondering what any of this has to do with your career as a retail trader. In the remainder of the article, I will tell you.
Fibonacci retracement levels use mathematical ratios popularized by Fibonacci to identify support and resistance points within a trend
Common retracement levels include 23.6 %, 38.2 %, 50 %, 61.8 %, and sometimes 78.6 %
In an uptrend, Fibonacci levels mark where the price may pull back and present potential buying opportunities
In a downtrend, these levels serve as resistance zones where selling pressure may resume after a retracement
Traders use Fibonacci levels to place stop-loss orders just beyond a level and take-profit targets near the next level
Drawing retracement levels requires identifying a recent swing high and swing low, then plotting horizontal lines at each key ratio
Fibonacci levels work best when combined with other tools like trendlines, moving averages, RSI or volume to confirm entries and exits
Retracement levels do not guarantee reversal; they provide a structured framework for timing trades within trending markets
What are the applications of the Fibonacci sequence?
In nature, Fibonacci numbers appear in the arrangement of leaves, flower petals, pinecones, and the spirals of shells, as they represent efficient growth patterns.
In art and architecture, artists and architects use the golden ratio for visually pleasing proportions, for example, those seen in structures like the Parthenon to Renaissance art.
Even in computer science, the Fibonacci sequence is used in algorithms, data structures, and the most efficient coding methods.
Finally, in retail trading, whether in stocks, commodities, FOREX, or cryptocurrencies, Fibonacci sequences can help judge whether a pullback is minor, moderate, or serious.
What are trading points and retracements?
A retracement is a temporary reversal in price movement that happens within an overall trend. In trading, these pullbacks can help identify possible entry points before the main direction resumes. Understanding retracements is essential when using Fibonacci levels to plan trades.
This usually means that the price is pulling back or "retracing" a portion of its recent gains or losses before potentially resuming in the original trend direction. This is what you are looking at when you see a trading chart with the zig-zag pattern that shows the movements of the asset price.
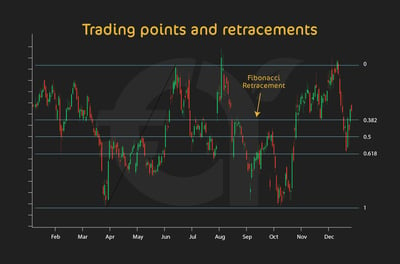
So, retracements are often smaller, temporary dips or jumps against the main trend direction. Therefore, in an overall uptrend, a retracement could be a temporary dip or drop in price. Visually, this would be a little zig-zag within the overall upward trend of a price.
In trading, Fibonacci retracement levels are best used in technical analysis to work out potential support and resistance levels during price trends. As you can imagine, this information could be very useful to a trader.
If you apply Fibonacci ratios like 23.6%, 38.2%, 50%, and 61.8% to recent price swings, you may identify a pullback before the trend continues. Here are some things you would do with the knowledge a Fibonacci trend gives you:
Identifying entry and exit points:
Fibonacci levels act as benchmarks where prices might reverse, helping you find buy or sell opportunities within trending markets.
Setting stop-loss and take-profit levels:
You can better place stop-loss orders just beyond key Fibonacci levels to manage risk, while you can set take-profit orders near these levels for the best exit points.
Forecasting market reversals:
The Fibonacci sequence helps traders gauge the likelihood of price retracements and reversals, making it a useful tool for navigating volatile markets.
Still confused? Read on.
Without getting into mathematical theory, I will explain how it works.
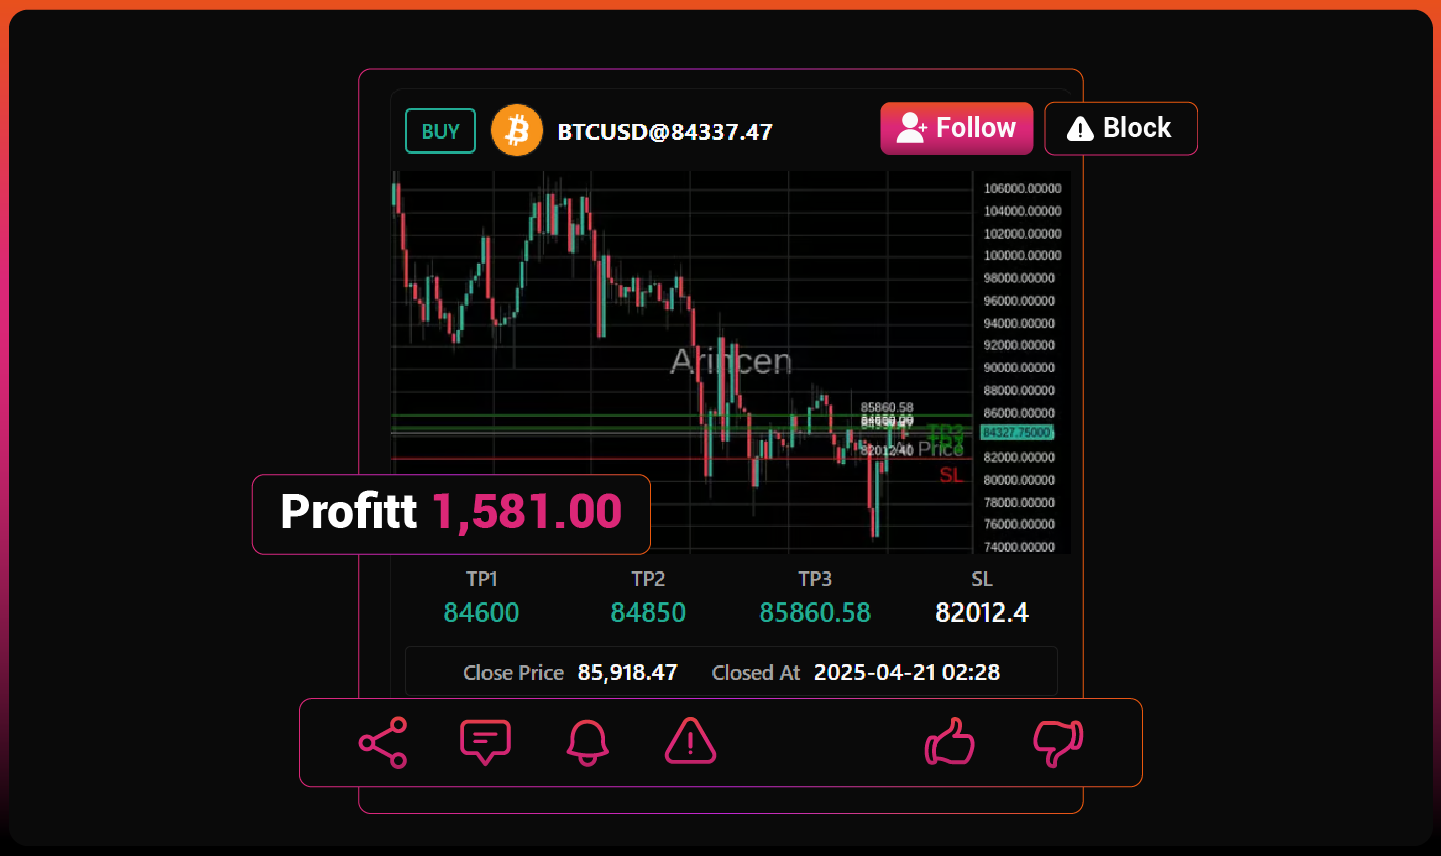
Trade with Real-Time Expert Signals
Follow live signals from experienced traders.
Get entry price, TP levels, SL, and closure updates.
Receive instant alerts when targets or stops are hit.
Track performance with clear, transparent stats.
Stay aligned with the market in real time.
How do Fibonacci retracement levels work?
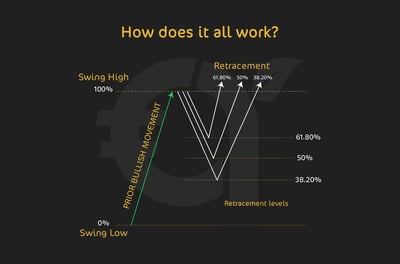
You will remember that the Fibonacci sequence is where each number is the sum of the two before it. In the case of trading, it has been found that key ratios include 23.6%, 38.2%, 50%, 61.8%, and 78.6%. This is where, over time, there is evidence of significant events in a trading context.
These Fibonacci numbers are percentages of the total distance between two price points. This is the high and the low of a recent significant price move. Put simply, a Fibonacci number is applied somewhere between the resistance and support levels of an asset price. These points are often called a "swing high" and "swing low" point. Let’s look at the significance of the percentages:
23.6%
Imagine you are tracking an overall price uptrend. If the trend were to pull back 23.6% of the way, this level is known as a shallow retracement, and it usually means that the uptrend is strong. You would expect the trend to quickly reverse and resume its uptrend.
But how do I know that a pullback is a 23.6% pullback when I don’t know how far the overall uptrend is? Good question. In all cases, we would assume that any new uptrend will be highly similar to the last one. So, when there is a pullback at 23.6% of this uptrend, we assume so because it is 23.6% of the last uptrend, too.
38.2%
If the price pulled back 38.2% of the way, this is a more significant retracement level, and you can be reasonably sure that it is a moderate correction in the trend. Many traders look for a bounce at this level if the overall trend remains strong.
50%
Although this number is not known as part of the traditional Fibonacci sequence, the 50% level is popular because of its historical importance in trading. Traders tend to respect this midpoint level as a “psychological” point, where buyers and sellers often pause to reconsider their positions.
61.8%
This is the ultimate golden ratio that has been observed in art, nature, and mathematics, as we have shown. This "golden ratio," or "golden mean," is one of the most important numbers in the sequence. Fibonacci and other mathematicians have proved that this number represents balance and harmony. For this reason, the 61.8% level is many times a key reversal zone in trading. If the price hits this level, many traders use it as a signal with a high probability of reversal, as it represents a deeper retracement of the initial move.
78.6%
A retracement can happen at this level, but it is normally known as a very deep retracement. It’s likely at this point that the trend is very close to being reversed, although it still might have a chance to bounce back. Traders watch for this level and use it when the initial trend is extremely strong, as this level can act as a last line of support or resistance before a full reversal.
As we can see, Fibonacci ratios are no more than retracement levels based on specific percentages that represent probable zones for price pullbacks within an established trend. These are informed by mathematical calculations and backed up by historical trading trends. In a world where traders are striving to gain an edge to beat the market, you can see how important this information would be.
Think of this, in an uptrend, a retracement to one of these levels might tell buyers where they can re-enter the market, while in a downtrend, they might mark where selling pressure could resume.
Be warned, this approach doesn’t guarantee outcomes, but it is a structured framework for understanding price behavior that is far better than having no idea when prices could pullback.
Using Fibonacci retracement levels takes a disciplined approach, where skilled and informed traders take advantage of the natural ebbs and flows of price movements.
What Are Fibonacci Retracement levels?
As we have seen, Fibonacci retracement levels can be used in an uptrend, where you can watch for pullbacks to these levels to find potential buying points, expecting the price to bounce back up from the support. On the other hand, in a downtrend, you can monitor these levels for selling opportunities, anticipating that the price may drop further after hitting resistance.
Using Fibonacci retracement levels helps you to apply a structured approach to price action analysis. By focusing on these set levels, you can better anticipate market behavior rather than guessing where a pullback might end. It gives you an insight into the natural rhythms of market trends, allowing you to align your strategies with anticipated price movements and find opportunities to enter or exit trades with greater precision. Without inside information like this, you could be operating at the mercies of human trading psychology, which is prone to emotional decisions.
The beauty of Fibonacci levels is in their simplicity. By applying these levels to price charts, you don’t need complex calculations to identify potential buying or selling zones. Once you understand them (and that’s easy to do when compared to the other technical analysis styles) Fibonacci levels give you a practical framework to align your trading strategies with market movements. This gives you a fighting chance to capture opportunities within trending markets and allows you to set realistic stop-loss and take-profit targets based on natural price behaviors.
Fibonacci level applications
I've seen this myself as a longtime trader. For instance, you could place a stop-loss just below a key Fibonacci level in an uptrend, protecting your position in case the support breaks. Similarly, you might set a take-profit target at a Fibonacci level in the direction of the trend, capturing gains if the price retraces to this level and reverses.
Using Fibonacci levels alongside other technical indicators, like moving averages or RSI, can further improve trade reliability by confirming signals. Ultimately, Fibonacci levels provide key market intelligence and a structured approach to understanding market behavior and timing trades. Now, natural price patterns are no longer simply unreadable random movements, but their rhythms come to represent actionable insights that can guide trading decisions in both trending and corrective phases.
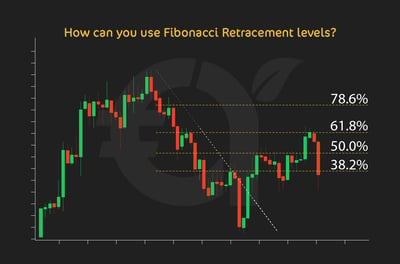
How can you use Fibonacci Retracement levels?
At this point, you may be wondering if you have to do more studying to understand how to apply Fibonacci levels to your trades. The good news is that you don’t need to learn much more than you already have in this article. All good trading platforms have an in-built Fibonacci trading tool that you can learn how to use, as long as you understand the theory behind what you are doing.
To use Fibonacci levels effectively, first identify the trend direction—is the price in an uptrend or a downtrend? Then, place the Fibonacci retracement indicator from the starting point (either the swing low in an uptrend or the swing high in a downtrend) to the end of the current move. This setup will show the Fibonacci levels—23.6%, 38.2%, 50%, 61.8%, and 78.6%—which act as potential support and resistance points within the trend.
As I've shown, in an uptrend, you often look for pullbacks to these levels to find buying opportunities, anticipating that the price will bounce back off the support level and resume its upward path.
Combining Fibonacci retracement levels with other indicators, like moving averages or RSI, can strengthen these setups by providing additional confirmation that the time is right to enter a trade.
By using Fibonacci levels as part of a disciplined approach, you can improve your ability to:
Time trades
Set realistic targets
Manage risk within both trending and corrective markets
How does Fibonacci retracement work in an uptrend?
Let’s see how this could all work out if a real trade were facing an uptrend. As shown in this example, Fibonacci retracement levels indicate potential support levels to watch for buying opportunities as the price temporarily pulls back before resuming its upward movement. Here’s a working example to illustrate how Fibonacci retracement levels work in an uptrend:
Imagine a stock rises from $100 to $150, showing a clear uptrend. After touching the $150 high, the price starts to pull back, giving you the signal to apply your Fibonacci retracement indicator. In this case, you would place it from the swing low at $100 to the swing high at $150. This setup generates Fibonacci levels at 23.6% ($138.20), 38.2% ($130.90), 50% ($125), and 61.8% ($119.10), which represent potential support levels within the pullback.
As the price retraces, it reaches the 38.2% level ($130.90), where it begins to stabilize and forms a bullish candlestick pattern. If you want to learn more about candlesticks, read our detailed article here.
At this point, you would be excited because it is a potential entry point for you, as you anticipate the uptrend will continue from this level. You could enter a buy position here, setting a stop-loss just below the 38.2% level to manage risk. If the price rebounds, then you can look to exit the trade near the previous high at $150 or higher if the uptrend strengthens.
This example shows how powerful the Fibonacci retracement level is. It serves as a guide to potential entry points, helping you strategically buy when the trend is more likely to resume.
So, by using Fibonacci retracement levels in conjunction with other indicators or price action signals, you can greatly improve the precision of your entries in an uptrend, taking advantage of natural pullbacks to enter at lower prices within a strong upward trend.
One practical point worth noting is that during volatile sessions, price often pierces a Fibonacci level briefly before reversing, which is why many traders wait for candle confirmation instead of treating the level itself as an automatic entry.
How does Fibonacci retracement work in a downtrend?
In a downtrend, Fibonacci retracement levels act as possible resistance points where traders may consider short opportunities. These levels are useful when price briefly moves upward before resuming its downward direction. An example helps show how the retracement can mark areas where selling pressure may return.
Think of a stock price that slides from $200 to $150. This is a clear downtrend. After hitting the low of $150, the price starts to move back up, and this is the time for you to apply your Fibonacci retracement indicator from the swing high at $200 to the swing low at $150.
By doing this, you have your Fibonacci levels set up at 23.6% ($161.80), 38.2% ($169.10), 50% ($175), and 61.8% ($180.90). These are potential resistance levels in the retracement.
As the price bounces upward, it would reach the 38.2% level at $169.10, where it would start to show signs of slowing or reversing. You can confirm this if it looks like a bearish candlestick pattern or a drop in buying momentum. At this level, you would be correct in thinking that it offers a possible entry point for a short position, as you have good reason to believe that the downtrend will resume. Remember, to manage risk, it would be a good idea to insert a stop-loss just above the 38.2% level to guard against a breakout.
If the price reverses downward as you expect, then you can exit the position near the previous low of $150, or even lower if the downtrend continues!
In this example, you can see how the Fibonacci sequence has allowed you to identify strategic points for short entries within the downtrend, giving you a window of opportunity to take advantage of temporary upward moves. As always, I would encourage you to combine Fibonacci levels with other indicators, such as volume or RSI. This would improve your accuracy in nailing the trading pullbacks in a downtrend.
The Bottom Line
The bottom line is that Fibonacci retracement levels offer a structured way to read market trends and identify potential entry and exit points. They help highlight areas where price may pull back before continuing in its main direction. In practice, this gives traders a clearer view of possible support and resistance zones.
When used with other indicators, they enable more disciplined, informed trading, helping you set precise stop-losses and profit targets that align with the market's natural flow. However, remember that while Fibonacci levels can guide decisions, they aren’t foolproof. Markets are always unpredictable, and price movements may not always respect these levels.
FAQ
The Fibonacci sequence is a number pattern where each value builds on the previous two. In trading, its ratios help mark areas where price may pause, pull back, or reverse within an existing trend.
Fibonacci retracement levels are percentage markers drawn between a swing high and swing low. Traders use them to spot possible support and resistance zones, especially during temporary pullbacks inside a broader trend.
First, you need to find a recent price high and low (an uptrend or downtrend swing). Then, apply the Fibonacci retracement tool between these points. The tool will automatically mark the key levels as horizontal lines on your chart, giving you a guide for potential price reversals or pauses.
The 61.8% level, known as the golden ratio, shows up in nature and design as a symbol of balance. In trading, it often acts as a powerful reversal point. When a price retraces 61.8% from a high or low, traders watch closely, as this level has a high probability of holding.
In an uptrend, you can place a stop-loss slightly below a Fibonacci level (e.g., 38.2%) to protect against unexpected dips. For take-profit, you might target a Fibonacci level above your entry if you believe the price will continue upward. This approach gives structure to your trading decisions.
Not exactly. While Fibonacci levels provide a structured approach, they’re not guarantees. Markets can break through these levels, so it’s best to use them with other indicators, like volume or RSI, to confirm signals and manage risk effectively.
Shallow levels like 23.6% suggest a strong trend with only minor pullbacks. Deep levels, such as 61.8% or 78.6%, are all about a larger price correction and a higher chance of a bounce back. Deep retracements can sometimes act as critical points where a trend could either reverse or continue.
Yes, Fibonacci levels are versatile. In an uptrend, they can help identify pullbacks where buyers may step in. In a downtrend, they act as resistance points, marking where sellers might push the price down again. They’re useful in any trending market.
Combine it with other indicators like moving averages, RSI, or candlestick patterns for confirmation. Look for signs of stabilization or reversal at these levels, and always set realistic stop-loss and take-profit targets based on the strength of the trend.
Find a clear recent price move first. In an uptrend, draw from the swing low to the swing high; in a downtrend, draw from the swing high to the swing low.
The most watched levels are 23.6%, 38.2%, 50%, 61.8%, and 78.6%. Shallow pullbacks can signal trend strength, while deeper ones may hint at a weaker trend or a possible reversal zone.
The 61.8% level comes from the Fibonacci number relationship that approaches the golden ratio. Traders watch it closely because price often reacts there as a major support or resistance area.
Yes. In an uptrend, traders watch retracement levels for possible buying zones. In a downtrend, the same levels can act as resistance areas where price may stall and continue lower.
A trader may enter when price reacts at a key level and shows confirmation. Stop-losses are often placed just beyond that level, while profit targets are set near prior highs, lows, or the next likely reaction zone.
A shallow retracement, such as 23.6%, usually suggests a strong trend. A deep retracement, such as 61.8% or 78.6%, means price has corrected more and may be closer to a full trend reversal.
It is better used with other tools, such as RSI, moving averages, volume, or candlestick patterns. Extra confirmation can help you avoid weak setups and improve timing for entries and exits.
No. Fibonacci levels are a framework, not a guarantee. Markets can ignore or break through them, so risk management and confirmation from other indicators are still essential.