Table Of Contents
- What is a Japanese Candlestick?
- What is the history of Japanese candlesticks?
- Why is technical analysis important in trading?
- What are the components of a candlestick?
- What are the different types of candlestick patterns?
- What are the top candlestick patterns?
- 1. Doji
- 2. Hammer
- 3. Hanging Man
- 4. Shooting Star
- 5. Engulfing Pattern
- 6. Harami Pattern
- 7. Piercing Pattern
- 8. Dark Cloud Cover
- 9. Morning Star
- 10. Evening Star
- 11. Three White Soldiers
- 12. Three Black Crows
- 13. Bullish Marubozu
- 14. Bearish Marubozu
- 15. Tweezer Tops
- 16. Tweezer Bottoms
- 17. Rising Three Method
- 18. Falling Three Method
- 19. Bullish Harami Cross
- 20. Bearish Harami Cross
- 21. Inverted Hammer
- Reading Candlestick Patterns
- Single candlestick patterns:
- Multiple candlestick patterns:
- Application of Japanese Candlesticks in Trading
- Pros and Cons of Japanese Candlesticks
- Pros:
- Cons:
- The Bottom Line
What is a Japanese Candlestick?
Japanese candlestick trading chart analysis has been used for centuries to read price action and spot potential market shifts. First developed in Japan for rice trading, these patterns became widely used because they offer a clear visual way to interpret the battle between buyers and sellers.
Today, Japanese candlestick patterns in FOREX trading and other markets help traders identify possible entry and exit points, reversals, and trend continuations. They can also reveal market psychology across a specific time frame. Still, no pattern guarantees success, and each must be read in context. In this article, I will discuss the 21 most important Japanese candlestick patterns and how traders use them.
A Japanese candlestick visualizes open, high, low and close prices in a single bar, providing a compact view of price action and market sentiment.
The candlestick body shows the difference between open and close while the wicks display the extremes reached during the period.
Candlestick patterns help traders spot potential trend reversals or continuations
Single-candle formations like Doji, Hammer, Shooting Star and Hanging Man signal indecision or turning points in the market.
Multi-candle patterns such as Engulfing, Harami, Piercing Line, Morning Star and Three White Soldiers offer stronger indications of momentum shifts.
Continuation patterns like Rising Three Method and Falling Three Method suggest the current trend may persist after a brief pause.
Candlesticks work across all markets and timeframes
Effective use of candlesticks comes from combining them with trend lines, support and resistance levels, and technical indicators for better decision making.
What is a Japanese Candlestick?
From what I know, the Japanese candlestick is a visual representation of price movements within a certain trading timeframe. Candlesticks can provide a clear, visual understanding of market dynamics.
By studying candlestick patterns over time, traders can gauge whether buying or selling pressure is dominant, helping them predict possible price movements.
What is the history of Japanese candlesticks?
Japanese candlestick charting began with rice traders in 18th-century Japan, who developed it to show open, close, high and low prices in a single figure. This format made market moves easier to read at a glance. It also helped traders spot price patterns more quickly and clearly.
For centuries, Japanese merchants and traders used candlesticks as a normal part of their daily lives until in the 1980s a technical analyst from the Western world picked up on these ideas and wrote a book about them.
Today, Japanese candlesticks are widely used in global financial trading, including FOREX, stocks, and commodities.
Traders use these patterns to identify entry and exit points, helping them manage risk and potentially increase returns.
I should say at this point that no single tool can predict market movements. However, Japanese candlesticks, when used with other technical analysis tools and indicators, can significantly improve a trader's ability to capture market trends.
Stay in Control of Your Investments
Build and manage your own portfolio with ease.
Track profits, dividends, gainers, and losers in real time.
Create a custom watchlist for the assets you care about most.
Get live updates on stocks, ETFs, cryptos, and commodities.
Access everything anytime through a sleek, flexible dashboard.
.webp)
Why is technical analysis important in trading?
Here at Arincen, we often speak about the importance of technical analysis, which is crucial in retail trading for several reasons:
- Identifying trends: By analyzing the market, you can spot price trends. Trendspotting is one of the most common calls to action in trading. Once you identify a trend, you can make a call to go long in an uptrend or short in a downtrend.
- Timing trades: You can decide on what will be the best entry and exit points for your trades. By analyzing patterns and using technical indicators, you can develop a good understanding of when the price's trading direction is likely to change.
- Risk management: If you can easily decipher the prevailing support and resistance levels of a financial asset, you can become better at setting stop loss and take profit levels, which can help you manage risk.
- Predict future price movements: No analysis method is foolproof, but with good technical analysis, you can use historical price movements to make educated guesses about future price behavior. Patterns often repeat in markets, making this a useful tool for forecasting. In fact, as you become more experienced, much of your skill will be based on knowing how to respond to patterns you have seen before.
- Independence: You can make independent decisions without relying on external advice or tips. This is a powerful ability. Yes, there is a lot of helpful advice out there, such as trading signals, but reading and interpreting price charts and indicators will help give you an edge over other traders.
- Applicable to any market: Japanese candlesticks are not just a FOREX thing. Whether you are trading stocks, commodities, FOREX, or cryptocurrencies, the principles of technical analysis stay the same and can be applied in any market.
- Efficiency: With modern charting software and trading platforms, technical analysis can be carried out consistently and highly efficiently. This allows traders to respond quickly to changing market conditions.
What are the components of a candlestick?
These items make up a Japanese candlestick pattern:
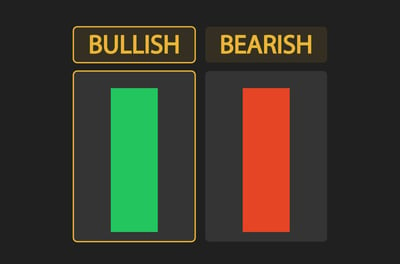
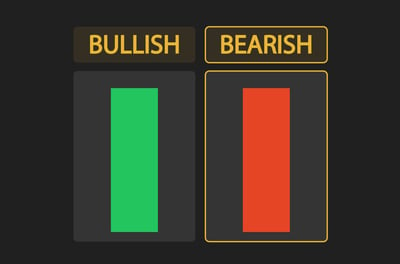
- Body: The body of the candlestick represents the range between the opening and closing prices during the specified period. If the body is filled (or colored), it means the closing price was lower than the opening price. This is a bearish movement. If the body is empty (or a different color), then the closing price was higher than the opening price. This is a bullish (upward) movement.
- Open: The open is the price at which a specific time period begins. In a bullish candlestick, the open is the bottom of the body. In a bearish candlestick, the open is the top of the body.
- Close: This is the price at which a specific time period ends. In a bullish candlestick, the close is the top of the body. In a bearish candlestick, the close is the bottom of the body.
- Wick (or Shadow): The wick of the candlestick represents the highest and lowest prices reached during the specified period. Wicks can easily provide information about price volatility and how much buying or selling pressure is being exerted on the market. If a candlestick has a long upper wick, for example, it suggests that buyers pushed prices up during the period, but sellers ultimately drove prices down again.
What are the different types of candlestick patterns?
From my experience, I can say that Japanese candlestick patterns can be broadly categorized into three categories: Bullish, Bearish, and Indecision/Neutral.
This has been the case since the beginning of the time these were used. Each pattern reflects market sentiment and can help traders forecast future price movements.
- Bullish patterns: These patterns signal that buying pressure exceeds selling pressure and prices may rise. Traders look for these patterns in a downtrend as an indication that the trend might reverse. Examples include the hammer, bullish Harami, and morning star.
- Bearish patterns: These patterns signal that selling pressure exceeds buying pressure and prices may fall. Traders look for these patterns in an uptrend to potentially signal a trend reversal. Examples include: Shooting Star, bearish Harami, and Evening Star.
- Indecision or neutral patterns: These patterns signal market indecision, where buying and selling pressures are relatively balanced, and a clear trend is not apparent. Traders look for these patterns to signal potential reversals or trend continuations. Examples include the Doji, Harami Cross, and Spinning Top.
What are the top candlestick patterns?
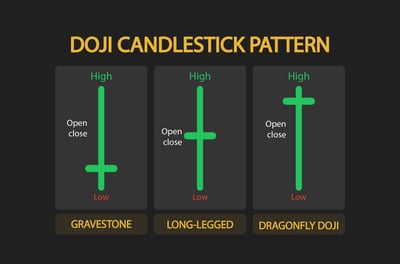
1. Doji
A Doji candlestick is one of the top candlestick patterns, and it signals market indecision because the opening and closing prices are nearly the same. It often appears as a cross or plus sign and can suggest that buyers are losing control after an uptrend. Its usefulness depends on the wider market context and where it appears in the trend.
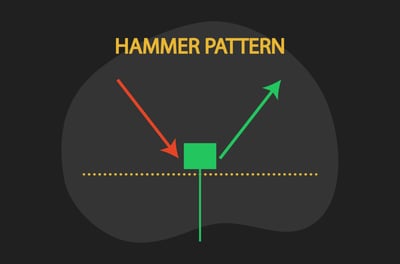
2. Hammer
If you see a Hammer after a downtrend, it suggests that the market is attempting to find a bottom. The hammer's long lower wick shows that sellers pushed prices down, but buyers managed to push the prices back up to near the open. This could be a good time to consider entering a long position. The Hammer is an example of a popular reversal indicators. A Hammer signals a bullish reversal after a downtrend, while a Hanging Man, which I will explain next, indicates a bearish reversal after an uptrend. Their limitations are that they are single-candle patterns, which might lead to false signals.
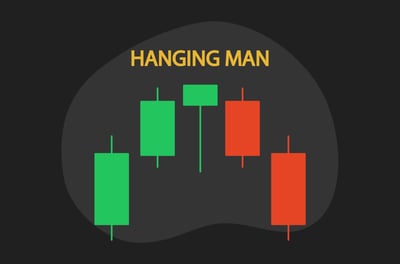
3. Hanging Man
If a Hanging Man forms during an uptrend, it could mean that sellers are beginning to outnumber buyers. It's possibly a good time to close long positions or enter a short position.
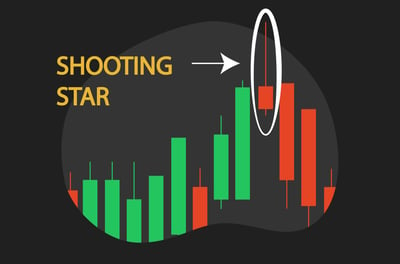
4. Shooting Star
The Shooting Star, appearing after an uptrend, signals potential bearish reversal. Its long upper shadow shows buyers pushed prices up, but sellers took control and pushed it back down. If confirmed, this might be a good point to initiate a short trade. The Shooting Star is one of those patterns that are often used because of their strong reversal implications. But again, as single candle patterns, it can sometimes provide false signals.
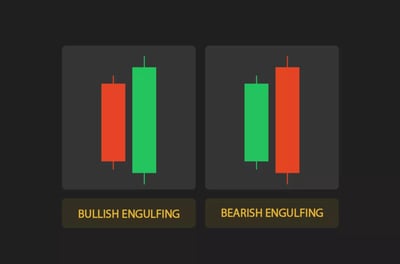
5. Engulfing Pattern
In a downtrend, if a small bearish candle is followed by a larger bullish candle (bullish engulfing), this could mean strong buying pressure. It could be time to make a purchase. On the other hand, in an uptrend, if a small bullish candle is followed by a larger bearish candle (bearish engulfing), it might be a good time to sell. The Engulfing Pattern is well-liked by traders because it can signal a strong reversal. The main disadvantage is that it requires confirmation from subsequent candles to confirm the signal.
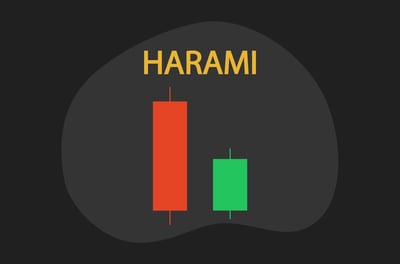
6. Harami Pattern
A bullish Harami forms when a small bullish candle follows a larger bearish candle in a downtrend, which could suggest a good time to buy. A bearish Harami occurs when a small bearish candle follows a larger bullish candle in an uptrend, indicating a potential time to sell. The Harami is frequently used because it can appear in either uptrends or downtrends. However, it is considered less reliable than some other patterns and often needs confirmation.
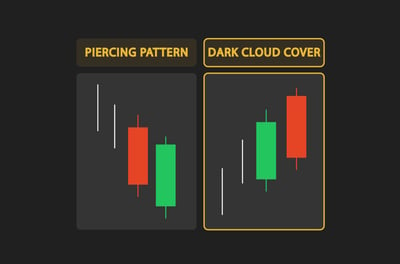
7. Piercing Pattern
If you see a Piercing Pattern in a downtrend, where a bullish candle opens lower but closes above the midpoint of the previous bearish candle, it could be a good time to buy.
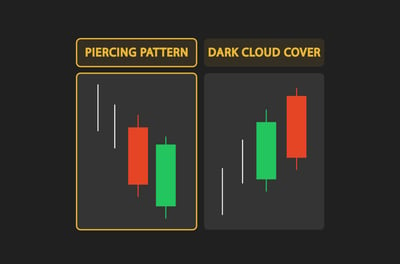
8. Dark Cloud Cover
The Dark Cloud Cover, appearing in an uptrend, is a bearish reversal pattern. It suggests that it you should consider selling or closing long positions.
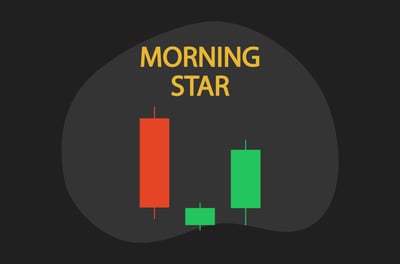
9. Morning Star
A Morning Star pattern appearing during a downtrend indicates a potential bullish reversal. The small candle or Doji suggests the trend is slowing, and the following large bullish candle suggests a reversal, possibly making it a good time to buy. The Morning Star, like the Evening Star which I discuss next, are both reliable reversal indicators over three periods, which makes them more trustworthy than single-candle patterns. The downside is that you are likely to see them less often.
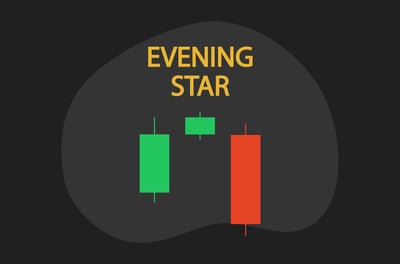
10. Evening Star
If an Evening Star forms during an uptrend, it suggests a bearish reversal. It might be a good time to sell or close long positions.
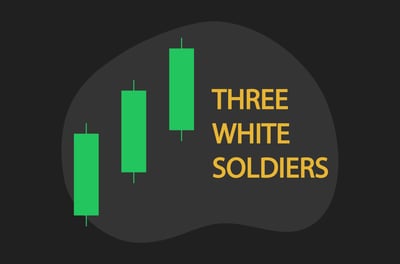
11. Three White Soldiers
If you see Three White Soldiers following a downtrend, it indicates strong buying pressure and a potential complete bullish reversal. It could be a good time to enter a long position. Three White Soldiers, just like Three Black Crows, are strong signals of a continued trend, but they don’t appear often, which limits their usage.
Recommended Brokers


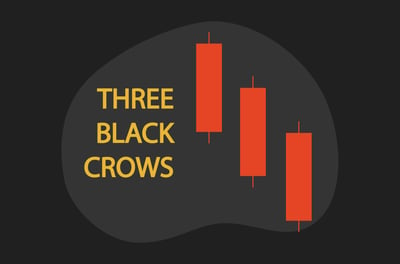
12. Three Black Crows
The Three Black Crows pattern signals strong selling pressure after an uptrend. This might be a good time to sell or enter a short position.
13. Bullish Marubozu
When this sign appears with no shadows, it shows that buyers controlled the trading from the opening bell to the close of the day, thus it might be a good time to buy or hold existing long positions. Bullish Marubozu candles are popular as they indicate strong buying or selling pressure. However, they do not provide information about potential reversals, which can be a drawback.
14. Bearish Marubozu
A Bearish Marubozu with no shadows shows that sellers controlled the trading from the opening bell to the close of the day. This might be a good time to sell or enter a short position. Like the Bullish Marubozu, the Bearish Marubozu does not provide information about potential reversals, which is a disadvantage.
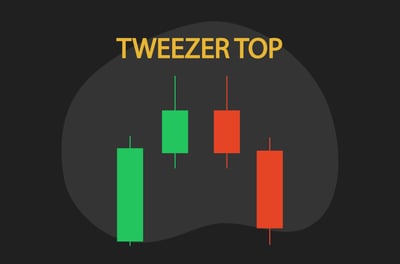
15. Tweezer Tops
Tweezer Tops form when two consecutive candles have the same high in an uptrend. This may indicate that the buyers have lost control and a bearish reversal may occur, possibly a good time to sell. Traders like these patterns for their reversal implications, but they may also give false signals in a quiet market.
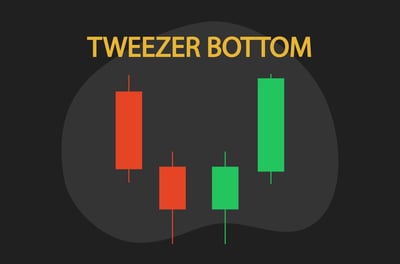
16. Tweezer Bottoms
This pattern forms when two consecutive candles have the same low in a downtrend. It may indicate that sellers are losing control, possibly a good time to buy.
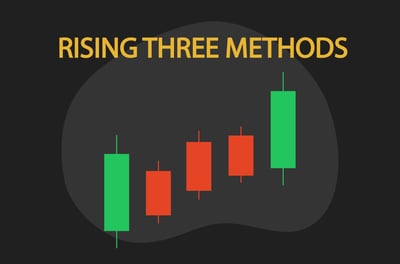
17. Rising Three Method
This sign in an uptrend signals continuation of the trend. After a long bullish candle, there are three shorter bearish candles, followed by another bullish candle. It suggests the market is taking a breather before continuing upward, so it might be a good time to hold existing long positions or consider buying. Continuation patterns like this are helpful to confirm an existing trend, but they have limited usefulness when the market is slow.
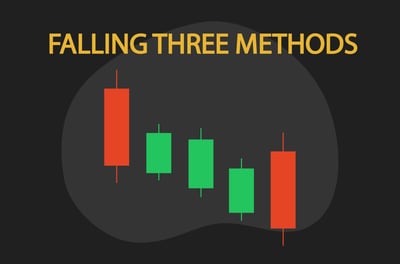
18. Falling Three Method
The Falling Three Method in a downtrend is the opposite of the Rising Three Method. After a long bearish candle, there are three shorter bullish candles, followed by another bearish candle. This might be a good time to hold existing short positions or consider selling.
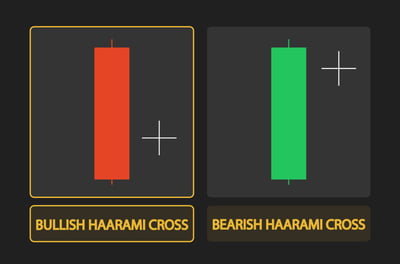
19. Bullish Harami Cross
This sign is a bullish reversal pattern where a doji follows a large bearish candle in a downtrend. It indicates a loss of downward momentum, suggesting a possible reversal and thus a potential buying opportunity. These patterns are useful in predicting potential reversals but, like other Doji patterns, they require confirmation from subsequent candles.
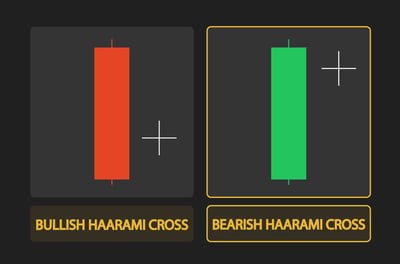
20. Bearish Harami Cross
The Bearish Harami Cross is a bearish reversal pattern where a doji follows a large bullish candle in an uptrend. It suggests loss of upward momentum, indicating a potential reversal and a potential selling opportunity. These patterns are useful in predicting potential reversals but, like other doji patterns, they require confirmation from subsequent candles.
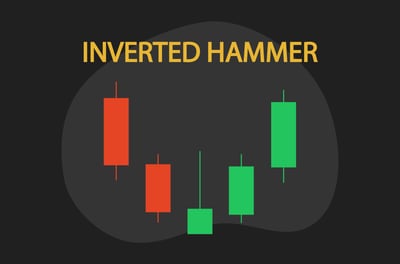
21. Inverted Hammer
An Inverted Hammer during a downtrend suggests a potential bullish reversal. The long upper wick indicates that buyers tried to push the price up, hinting at a change in momentum. It might be a good time to consider buying.
As a trader, you should remember that the popularity of Japanese Candlestick patterns does not necessarily mean higher success rates. Effective trading often involves combining candlestick patterns with other tools, such as trendlines, moving averages, Fibonacci indicators, and Bollinger bands, to confirm signals in practice.
Reading Candlestick Patterns
In my view, reading Japanese candlestick patterns involves understanding the price action each pattern represents, which can be broken down into two categories: single- and multiple-candlestick patterns.
Single candlestick patterns:
As the name suggests, these consist of just one candlestick and are often easier to spot. They can provide valuable information about market sentiment.
Doji: A Doji has a very small or non-existent body, meaning that the opening and closing prices were nearly identical. This pattern indicates indecision in the market, suggesting a potential shift in the price trend.
Hammer/Inverted Hammer: A Hammer candlestick occurs when a security trades significantly lower than its opening, but gets stronger later in the day to close either above or close to its opening price. You will see a hammer-like shape with a long lower wick and a small body. An Inverted Hammer looks the same, but it occurs at the bottom of a downtrend. Both patterns suggest a potential bullish reversal.
Shooting Star/Hanging Man: A Shooting Star and Hanging Man have small bodies near the low with a long upper shadow and little to no lower shadow. The Hanging Man graphic typically forms during an uptrend and can suggest a potential reversal downward, while the Shooting Star typically forms during a downtrend and can signal a potential reversal upwards.
Multiple candlestick patterns:
These patterns are formed from two or more candlesticks and can provide traders with a deeper understanding of market dynamics.
Bullish/Bearish Engulfing: These patterns occur when a small candle is followed by a large candle of the opposite color that completely engulfs the prior candle. A Bullish Engulfing pattern highlights a shift in control from sellers to buyers, while a Bearish Engulfing pattern highlights the opposite transition from buyers to sellers.
Morning Star/Evening Star: These are three-candlestick patterns. A Morning Star pattern occurs after a bearish trend and is best read as a three-candle transition from weakening selling pressure to renewed buying interest. It consists of a large bearish candle, a small candle or a Doji, and a large bullish candle. An Evening Star pattern is exactly the opposite, signaling a potential bearish reversal after a bullish trend.
Harami: This pattern consists of a large candle followed by a smaller candle that is entirely within the range of the first candle's body. You should know that the Bearish Harami appears near the end of upward momentum, while the Bullish Harami appears near the end of downward momentum, making both useful as early warning patterns rather than standalone trade signals.
Application of Japanese Candlesticks in Trading
In my experience, Japanese candlesticks are a valuable tool in trading because they can help identify potential trend reversals and provide insights into market psychology. Here's how some key elements apply:
Identifying Trend Reversals: Reversals indicate that an ongoing trend might be ending and a new one beginning. Japanese candlestick patterns, such as Doji, Hammer, Inverted Hammer, Hanging Man, and Shooting Star, can often signal these potential reversals. Think of this example - a Doji candlestick at the top of an uptrend may suggest that the bullish momentum is getting weaker, and a bearish reversal may happen soon. On the other hand, a Hammer at the end of a downtrend can signal a potential bullish reversal.
Hammer and Hanging Man: The Hammer and Hanging Man are single-candlestick patterns that traders often compare because they share a similar shape but appear in different trend contexts. The Hammer occurs after a downtrend and signals a potential bullish reversal.
Visually, it has a small body and a long lower wick, indicating a period when sellers were outperformed by buyers, pushing the price back upward. By contrast, the Hanging Man happens after an uptrend and suggests a potential bearish reversal. It also has a small body and a long lower wick, indicating that even though there was a large sell-off during the period, buyers successfully pushed the price back up. Remember, the presence of selling pressure during an uptrend can suggest a trend reversal.
Engulfing Patterns: Two-candle patterns that can signal potential reversals. The Bullish Engulfing pattern, in which a small bearish candle is engulfed by a larger bullish candle, suggests that buyers have overtaken sellers and a bullish reversal may occur. I've often seen it at the end of a downtrend. Quite the opposite: the Bearish Engulfing pattern, marked by a small bullish candle completely covered by a larger bearish candle, signals that sellers have overwhelmed buyers and that a bearish reversal may be on the horizon. It is often spotted at the end of an uptrend.
Pros and Cons of Japanese Candlesticks
Pros:
1) Versatility: Candlestick patterns can be used in any market, including FOREX, commodities, stocks, etc., and on any timeframe, from 1-minute charts to monthly charts. Further, you will often find clear visualization of price action.
2) Visual appeal: Candlestick charts are visually intuitive and easy to understand, making them appealing to many traders. They have very clear visualization. The various shapes and colors can quickly convey the dynamics of price movement.
3) Insight into market psychology: Candlestick patterns provide insights into market sentiment and trader psychology, offering clues about potential reversals or continuations.
4) Combination with other indicators: Candlestick patterns can be effectively combined with other forms of technical analysis, like trend lines, resistance and support levels, or technical indicators. This gives them more predictive power.
Cons:
Subjectivity and bias: Interpreting candlestick patterns can be a little subjective. Two traders may not always agree on the identification of certain patterns, leading to different trading decisions.
1) False signals: Like all technical analysis tools, candlestick patterns can sometimes provide false signals. A pattern that usually indicates a trend reversal might not always lead to a reversal, leading to potential trading losses.
2) Lack of quantitative indicators: Candlestick patterns are primarily qualitative and don't provide numerical such data as volatility, momentum or relative strength that other technical indicators offer.
3) Need for confirmation: Candlestick patterns often need confirmation from additional candles or other technical analysis tools, which might delay trading decisions. For this reason, candlestick signals should be confirmed with context, such as trend direction, support and resistance, or another indicator.
While Japanese candlestick patterns are a powerful tool for understanding market psychology and suggesting possible price movements, they should always be used as part of a comprehensive trading strategy that includes other technical analysis tools, risk management and sound trading principles.
The Bottom Line
Japanese candlestick trading chart analysis remains one of the most practical ways to read price action and understand market sentiment. These patterns help traders spot potential reversals, trend continuations, and the ongoing struggle between buyers and sellers, but they are not infallible.
Used properly, candlesticks work best alongside other forms of technical analysis to confirm signals and manage risk. If you want to build a deeper understanding, we've written an even more comprehensive Japanese candlestick guide, which you can access here. Mastering their meaning can become a valuable edge in modern retail trading.
FAQ
Each candlestick has a body and wicks, also called shadows. The body shows the distance between the open and close, while the wicks mark the highest and lowest prices reached during that period.
You read candlesticks by studying the body size, wick length, color, and position in the trend. Together, these clues can reveal buying or selling pressure, indecision, and possible reversals or continuations.
Common bullish patterns include the Hammer, Bullish Engulfing, and Morning Star. Common bearish patterns include the Hanging Man, Shooting Star, Bearish Engulfing, and Evening Star.
Traders look for reversal patterns after clear uptrends or downtrends. For example, a Hammer after a decline may suggest a bullish turn, while a Shooting Star after a rise can point to weakening buying pressure.
Candlesticks are visual, flexible, and useful for reading market psychology. Their limits are subjectivity, false signals, and the need for confirmation from other tools before making trading decisions.
No, candlesticks cannot guarantee success or predict the market with certainty. They are best used as one part of a broader trading plan that includes confirmation tools, clear entries and exits, and disciplined risk control.
A Japanese candlestick chart is a price chart that shows the open, high, low, and close for a chosen time period in one candle. It helps traders quickly read price action and market sentiment.
They can be useful for spotting market psychology and potential turning points, but they do not work every time. Their signals are stronger when combined with trend analysis, support and resistance, and risk management.
There is no single most reliable pattern in every market. Multi-candle setups like Morning Star, Evening Star, Three White Soldiers, and Three Black Crows are often seen as stronger because they show clearer confirmation.
Yes. Candlestick analysis can be used across forex, stocks, commodities, and cryptocurrencies because it is based on price action. The same principles also work on different timeframes, from intraday charts to longer-term charts.