Table Of Contents
- Who created Bollinger Bands?
- What Are Bollinger Bands?
- How do Bollinger Bands work?
- Basic Trading Signals from Bollinger Bands
- Should you use Bollinger Bands with other indicators?
- What do Bollinger Bands look like in live examples?
- What are the best beginner tips for using Bollinger Bands?
- What common mistakes should you avoid with Bollinger Bands?
- Conclusion
Mastering Bollinger Bands: A Trader’s Guide to Smarter Market Moves
The Bollinger Bands Indicator can help traders spot breakouts, pullbacks, and shifts in market volatility before they become obvious. For retail traders, that makes it a valuable tool for finding potential entry and exit points with more confidence.In this guide, I’ll explain the structure and components of Bollinger Bands, how they respond to changing market conditions, and the trading signals they can reveal. You’ll also learn how to use them alongside Relative Strength Index (RSI) and Moving Average Convergence Divergence (MACD) to build a stronger, more informed strategy.
Bollinger Bands track market volatility and help traders identify breakout and pullback opportunities as bands expand or contract
The indicator consists of a middle band, which is usually a 20-period simple moving average, with upper and lower bands placed two standard deviations away
When price reaches the upper band, it often signals overbought conditions and the potential for a pullback
Touching the lower band suggests oversold conditions and the possibility of a price bounce
The bands expand during strong trends or sharp moves, reflecting increased volatility and market momentum
A squeeze occurs when the bands contract tightl,y which often signals low volatility and precedes a breakout
Traders use Bollinger Bands for entry and exit points, placing stop-losses just beyond the bands and profit targets near the opposite side
Bollinger Bands work best when combined with tools like RS,I MACD, or trendlines to improve confirmation and reduce false signals
Who created Bollinger Bands?
John Bollinger created Bollinger Bands in the 1980s to help traders visualize market volatility and spot potential trading opportunities. The indicator stood out because it adapted to price changes more effectively than many static tools used at the time. That made it a more flexible way to read changing market conditions.
Bollinger had been looking for a dynamic system that could capture how constantly the market changed. He came up with the solution that involved a set of bands that expanded and contracted based on price movement and volatility.
John Bollinger used standard deviations, a statistical measure of which you may be aware, to adapt the width of the bands around a moving average. The result of this was that he created a highly responsive indicator that responded instantly to changing market conditions.
Not surprisingly, Bollinger Bands quickly became popular with traders across all types of financial assets. Further, with the advent of computers, these fast-moving prices could now be better visualized on digital charts.
Traders realized that the bands gave them insights not just into volatility but also the relative strength of price movements. Since then, Bollinger Bands have become a vital part of many trading strategies.
Your best bet is to use them together with other indicators to identify overbought or oversold conditions, predict potential breakouts, and manage risks.
This was a significant development in technical analysis because it provided traders with a more real-time understanding of price activity. Rather than being confined by rigid levels, Bollinger Bands gave traders a flexible, adaptable way to assess potential price reversals or continuations.
Stay in Control of Your Investments
Build and manage your own portfolio with ease.
Track profits, dividends, gainers, and losers in real time.
Create a custom watchlist for the assets you care about most.
Get live updates on stocks, ETFs, cryptos, and commodities.
Access everything anytime through a sleek, flexible dashboard.
.webp)
What Are Bollinger Bands?
Bollinger Bands are a technical indicator that adjusts to price action to help traders measure volatility and assess market conditions. They are dynamic rather than static, which makes them useful in changing markets. This gives traders clearer context when evaluating possible setups.
A great thing about them is their versatility. The bands are used across various trading strategies, from spotting early signs of a breakout to identifying when a price might be overbought or oversold.
Now, let’s get to the bottom of what Bollinger Bands actually are. Essentially, we are talking about a set of three lines plotted on a price chart that indicate price movement and volatility. Think of Bollinger Bands as an envelope around the price, showing how far it strays from its average as it expands or contracts with recent price action.
Here’s what Bollinger Bands look like:
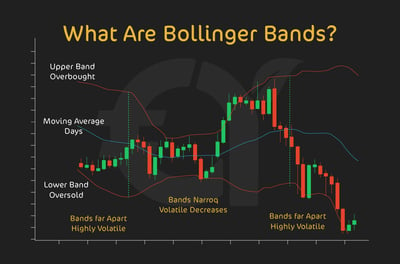
The most important parts of Bollinger Bands are:
The middle band
This section of the Bollinger Band is nothing more than a middle band that faithfully tracks a moving average of the price. One common example of this is the 20-day Simple Moving Average (SMA). This band is highly important since it acts as the guide around which the other two bands are calculated. The SMA smooths out price data to create a clearer view of the average trend direction over a set time, thus helping you to identify the general direction of the market.
The upper band
When you see the upper band, you are looking at an indicator that is always two standard deviations above the middle band. What this shows is the upper limit of price movement, adjusted for recent volatility.
Sometimes the prices move closer to, or even touch, the upper band. This most often indicates that the market is overbought. Now could be a good time for a potential reversal or a cooling off in the price trend.
As you can imagine, this band is useful in working out where prices might struggle to keep rising.
The lower band
I've learned that the lower band can be found two standard deviations below the middle band. Think of it as a lower boundary for price action, suggesting that an asset may be oversold. In the same way as the upper band, the lower band adjusts to the market’s volatility. When prices dip toward or touch the lower band, it suggests that selling pressure might be reaching an extreme, often signaling a potential bounce back or price correction.
There you have it. These three elements work together to create a much clearer representation of price volatility. As price action becomes more volatile, the bands will widen, and as it stabilizes, they will contract.
This ability to expand and contract gives you an instant read on market activity, helping you make better-informed trading decisions.
Bollinger Bands provide not only a framework for understanding volatility but also a context for evaluating current price levels relative to recent market history.
How do Bollinger Bands work?
Bollinger Bands are very good at painting a picture of market volatility by expanding and contracting in response to price movements. As a trader, the ability to really see how active or calm a market is can be highly useful.
In practice, the bands expand as volatility increases, making the distance between the upper and lower bands visibly wider. This normally happens during periods of rapid price movement, such as a strong upward trend or a sudden drop. When you see the bands widen significantly, it is a sure sign that the market is highly volatile. You could use these sharp price movements as a guide that price trends are strong. However, you should also be cautious as volatility can often lead to unpredictable swings.
On the other hand, Bollinger Bands contract, or narrow, when volatility is lower. Visually, you will notice that the bands are closer together. It’s a sign that price movements are more stable. This could happen during a consolidation phase where the market moves sideways. These contracted periods typically indicate a market without momentum.
The dynamic nature of Bollinger Bands makes them a convenient, reliable way to assess current market volatility and stay alert for potential price changes. When price signals and candlesticks are hard to read, Bollinger Bands offer a shorthand view of market volatility, helping you time trades and set stop-losses and take-profits.
Basic Trading Signals from Bollinger Bands
Bollinger Bands generate basic trading signals by showing how price behaves relative to volatility and the bands themselves. Common examples include the squeeze, riding the bands, and mean reversion. Traders use these signals to identify potential opportunities and respond to changing market conditions.
The squeeze
This is one of the most popular trading signals you get when working with Bollinger Bands. The "squeeze," as it’s called, happens when the upper and lower bands move closer together, meaning that volatility is low and there is very little happening in terms of volatility. It simply means the market is "compressing," which should normally put you on alert for a major breakout.
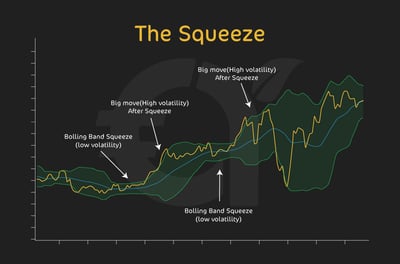
I should warn you that the squeeze doesn’t predict the direction of the breakout; it’s just a pointer that a breakout could be about to happen. The breakout could be up or down. You should be on high alert that it will happen, but you won’t know how it will break. In moments like these, smart traders use this information to get ready for action. How? By setting alerts or using other indicators like volume to confirm the direction of the next move.
In my own chart review over the past 12 months, the squeezes that produced the cleanest follow-through were usually the ones confirmed by a clear rise in volume or momentum, while unconfirmed squeezes were far more likely to whipsaw.
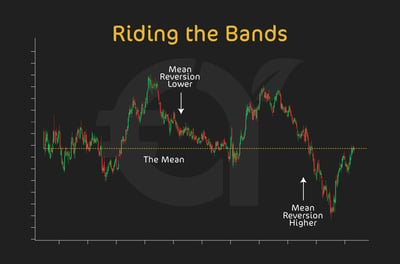
Riding the bands
Another common phenomenon with Bollinger Bands is when the price trend is strong, and you see the price action "ride the bands." This simply means that it moves along the upper or lower band. In an uptrend, the price could consistently touch or stay near the upper band. In a downtrend, it might do the same with the lower band.
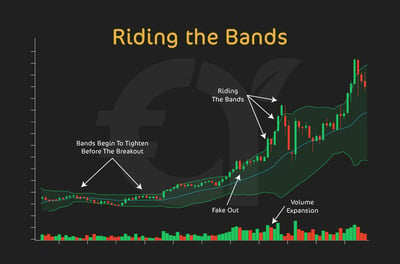
This riding of the bands shows strong price momentum. You would be forgiven for thinking that touching the bands isn’t necessarily a reversal signal during a strong trend. In reality, it’s actually a sign of trend confirmation. Traders often search for a continuation when they witness prices riding the bands, as opposed to expecting a reversal.
Mean reversion
Traders believe that, over time, prices often return to their average value, represented by the middle band. The most reliable expression of an average value is usually a 20-day moving average. You should know that when prices hit the upper or lower bands, they are normally far from the average. It’s quite likely that they will revert back to the middle. You can use this signal to identify potential entry and exit points, betting that the price will gravitate back to the middle band after reaching an extreme. For instance, if the price touches the lower band and shows that it is stabilizing, you could take this as an opportunity to buy, full in the expectation that it will at some point come back to the middle band.
In my opinion, these three basic trading signals are what make Bollinger Bands a versatile tool. Once you master them, you can use them to identify trends and sense when a market is ready for a potential reversal or breakout. Once you understand these signals, you have the best chance of making more informed decisions based on price action.
Should you use Bollinger Bands with other indicators?
Yes, Bollinger Bands are often more effective when used with other indicators to confirm signals and improve decision-making. While they can work on their own, combining them with tools like RSI or Fibonacci analysis can add context. This helps traders build more confidence in their setups.
Using RSI to confirm signalsThe RSI measures overbought and oversold conditions on a scale of 0 to 100. It is a powerful tool because it provides a quantifiable measure that traders can use to assess the strength of overbought or oversold conditions.
By combining RSI with Bollinger Bands, you can get a far better sense of potential reversals or continuations. Think of it this way: if the price touches or goes over the upper Bollinger Band while RSI reads above 70, it could mean that it’s an overbought market with a higher likelihood of a price pullback. On the other hand, let’s say the price hits the lower Bollinger Band and the RSI is below 30; this could very well mean the asset is oversold and ready for a bounce. So, when you use both indicators together, you can swerve all the false signals and gain a clearer picture of whether a reversal is likely. In backtesting notes from reviewing multiple liquid forex and equity charts during high-volatility sessions, I’ve found that Bollinger Band touches become more actionable when RSI is already at an extreme rather than merely approaching it.
Using MACD to confirm signalsThe MACD is another useful way of reading the market. This trend-following indicator helps you identify the direction of a trend and its strength. When used together with Bollinger Bands, the MACD can often confirm breakouts or trend continuations.
For example, during a "squeeze," you might look for a MACD crossover. This is when the MACD line crosses above the signal line. This could be a good clue that an upward breakout could be about to happen. By the same token, if the price is riding the bands in a strong uptrend, an increasing MACD histogram can confirm that the trend has momentum, meaning that a sudden reversal probably won’t happen.
By combining different indicators, you can more safely differentiate between true opportunities and false signals. Think of these extra indicators as an added layer of validation. This confidence allows you to better time your entries and exits. This multi-indicator approach works best in volatile markets, when it might be dangerous to rely on a single indicator to tell the full story.
What do Bollinger Bands look like in live examples?
Live examples show how Bollinger Bands can help traders identify opportunities and follow market trends in real time. They make the indicator easier to understand by applying it to actual price action. This gives traders a clearer view of how the bands can support trading decisions.
Example 1: The squeeze and breakoutImagine that a stock in which you’ve invested is trading within a narrow range and you notice that the Bollinger Bands are contracting sharply. By now you know that the asset is in a "squeeze," which means that volatility is low, and a major price change could be about to happen.
In this scenario, let’s say the price breaks above the upper band, and the trading volume starts to increase. You would be correct in feeling that this looks very much like a breakout to the upside, signaling a potential buy. By using the bands, you could have anticipated this extra volatility and been prepared to enter the trade as soon as the breakout happened, riding the trend higher to your advantage.
Example 2: Riding the bands in an uptrendLet’s look at another situation where a stock is in the middle of a strong uptrend, and the price keeps touching the upper Bollinger Band without reversing. Some traders might feel that the price will surely pull back, but in this case, riding the upper band is a sustained buying pressure signal.
This example shows the price consistently moving along the upper band for many days. During this time, the middle band (the 20-day SMA we spoke about) acts as dynamic support. You can confidently use this as a signal to hold your long positions, as the price "riding the band" shows strong momentum. If you were to exit prematurely when the upper band was first touched, you could miss opportunities for extra gains.
Example 3: Mean reversion in a downtrendLet’s take an example of a downward-trending asset. Imagine the price touches the lower Bollinger Band, and, at the same time, the RSI plummets under 30. This may indicate the asset is oversold. Here, the price starts to stabilize and move back toward the middle band.
What we’ve just seen is a classic example of mean reversion (from the term "reverting to the mean"), where the price moves from an extreme back to its average. By using this strategy, you could see the price touching the lower band as an opportunity to buy, since you expect it to revert to the middle band. This type of trade is great for short-term gains within a broader trend, allowing you to capitalize on smaller price corrections.
As we’ve seen, you can effectively integrate Bollinger Bands into your trading strategy. Whether you’re looking for signs of a soon-to-happen breakout, a strong trend continuation, or even a potential price correction, Bollinger Bands give you a visual framework on which you can rely. You should know that Bollinger Bands are highly adaptable, and you can be ready for any situation, ranging from fast breakouts to steady trends and sharp reversals.
What are the best beginner tips for using Bollinger Bands?
The best beginner tips for using Bollinger Bands are to practice consistently, learn how the bands reflect volatility, and apply them with patience. Although the indicator is powerful, it takes time to use it effectively. A solid understanding of the basics can help beginners avoid unnecessary mistakes.
Get to grips with volatilityBollinger Bands are a great tool to reflect market volatility. By understanding what volatility really means, you can better interpret the bands. When the bands widen, expect price action to be more volatile. When they get narrow, be on the lookout for potential breakouts.
Bollinger Bands can spot overbought and oversold levelsOne of the best ways to use Bollinger Bands is to identify overbought and oversold conditions. When the price hits the upper band, it may signal the market is overbought. This is prime territory for a pullback.
When the price touches the lower band, the market could possibly be oversold. This is when you need to start preparing for a possible bounce back. Remember, this is not guaranteed, and you should always look for confirmation from another indicator before acting.
Remember to pair Bollinger Bands with other indicatorsWe know that Bollinger Bands provide important information, but their effectiveness is even greater when paired with other indicators such as RSI or MACD. Think of this: if the price touches the upper band and the RSI also hints at overbought conditions, you have much stronger evidence that a reversal might be coming. Using multiple indicators simultaneously gives you a fuller picture.
Don’t assume the price will always come backA common mistake beginners make is assuming that whenever the price touches the upper or lower band, it will automatically return to the middle band. You should be aware that during strong trends, prices can "ride the band" for a long time. Avoid the temptation to leap to buy or sell when the price hits an outer band. You should look for more signs that the market is ready to turn.
Practice with different time framesBollinger Bands are useful across all time frames. They could be as short as one-minute charts or as long as daily or weekly charts. Be sure to practice on different time frames until you get the full hang of how Bollinger Bands act throughout different types of market conditions. In general, shorter time frames offer more frequent signals but need you to act sooner. On the other side of things, longer time frames tend to give you more durable signals as a swing (long-term) trader.
Bands are guidelines, not gospelFor all I’ve said to talk up the value of Bollinger Bands, they are not a crystal ball. No indicator is foolproof. Market conditions change rapidly, and there are no guarantees. That’s why Bollinger Bands should be no more than one piece of a larger strategy. I would always advise you to match them with sound risk management techniques and different forms of analysis.
One pattern I repeatedly see during strong trend days is traders shorting the first touch of the upper band too early; in practice, waiting for momentum to weaken first is often safer than assuming the band itself will cap price.
What common mistakes should you avoid with Bollinger Bands?
Common Bollinger Bands mistakes include misunderstanding the indicator, misreading signals, and using it without enough experience or context. Although the tool is versatile, it can still be applied incorrectly. Knowing these common mistakes can help traders use the indicator more effectively.
Reversal signals are not guaranteedOne of the biggest mistakes beginners make is assuming that the price will always reverse when it touches the upper or lower Bollinger Band. We’ve already shown how, in a strong trend, the price can "ride the band" for a long time without reversing. To avoid falling into this trap, you should always use additional indicators, such as RSI, to give you more information that a reversal is in the pipeline.
Ignoring market trendsIn my opinion, Bollinger Bands are great at showing volatility, but they don’t always give you a clear indication of market direction. If you home in on Bollinger Bands and nothing else, you could be failing to see the wood for the trees. You have to consider the overall trend, or you could misinterpret the signals.
For instance, during a strong uptrend, the price could repeatedly hit the upper band without reversing, and if you simply assume it will drop, you could end up with a losing trade. Understanding the full picture of the market trend is the best way to use Bollinger Bands.
Using bands on their ownSome traders use Bollinger Bands as their only tool because they are so easy to read. However, relying solely on Bollinger Bands can lead to false signals. You must always combine Bollinger Bands with other indicators to confirm the trades you want to make.
For example, during a "squeeze" phase, using RSI or watching trading volume can give you excellent clues about the direction of the upcoming breakout.
Misreading the squeezeThe squeeze is great at reading low-volatility situations, and the natural response is to prepare for a breakout. However, some traders make the mistake of assuming that a breakout will be strong or last for a long time, regardless of the other noise the market is making. This is a mistake. The squeeze doesn’t tell you anything about the direction of the breakout—just that volatility is about to go up.
Overcomplicating trades with tight stopsIt’s perfectly understandable to set tight stop-loss orders just outside the Bollinger Bands because you expect the price to respect these boundaries. But what if it doesn’t? Markets are nothing if not unpredictable. How many times have you seen prices briefly spike beyond the bands before returning to normal? This situation can see you getting “stopped out” unnecessarily. Give your trades some breathing room and don’t set stops too tight, especially in volatile markets
Failing to adjust for market conditionsBollinger Bands are adaptable, but their default settings (usually a 20-day SMA) are not suited to all market conditions. During volatile periods, the default settings might produce bands that are either overly wide or too narrow, leading to misleading signals.
You have to be prepared to adjust your parameters to suit different assets or market conditions. Testing your signals over time, based on the particular asset and trading environment, can help you get more accurate signals.
Conclusion
The Bollinger Bands Indicator gives traders a practical way to read volatility, identify potential breakouts, and spot possible overbought or oversold conditions. By understanding its three-band structure and combining it with tools like Relative Strength Index (RSI) and Moving Average Convergence Divergence (MACD), you can make your market analysis more balanced and reliable.The key is to use Bollinger Bands as part of a broader strategy, not in isolation. Practice on charts, test different market conditions, and refine how you apply the signals before risking real capital.
FAQ
Bollinger Bands show you price volatility. When the bands widen, there is more volatility, often indicating strong trends, while narrow bands suggest low volatility, usually a calm period before a breakout.
This is when the upper and lower bands contract, indicating that the market is in a low volatility phase. It’s a signal to be on high alert because a significant breakout is likely to happen soon, though its direction (up or down) isn’t certain.
No, you shouldn’t assume a price reversal every time it touches an upper or lower band. During strong trends, prices can "ride the band" for an extended period.
When the price touches the upper or lower Bollinger Band, combining it with the RSI helps confirm potential reversals. For instance, if the price hits the upper band and the RSI is above 70, it may signal that the asset is overbought and could soon pull back.
Bollinger Bands expand when market volatility is high, showing that prices are moving strongly in one direction. On the other hand, they contract when the market is stable, indicating lower volatility.
Riding the bands means that the price is moving along the upper or lower band, suggesting strong momentum in that direction. In an uptrend, if the price rides the upper band, it indicates sustained buying interest. Instead of expecting a reversal, this is usually a confirmation of the trend. If you’re already in the trade, it’s a signal to hold your position rather than exit prematurely.
You can, but it is riskier. Bollinger Bands are best used as part of a wider strategy with tools like RSI, MACD, volume analysis, and sound risk management to reduce false signals.
While it might seem logical to set tight stop-loss orders just outside the bands, it’s often better to give your trades a bit of breathing room. Prices can sometimes spike beyond the bands before reverting, which can lead to unnecessary stop-outs. You could be missing out on potential gains if you set your stop loss too tight.
Bollinger Bands show volatility and how far price has moved from its recent average. Wide bands suggest stronger activity, while narrow bands can signal consolidation and a possible breakout setup.
The squeeze happens when the bands narrow because volatility has dropped. It often warns that a larger move may be coming, but it does not tell you whether the breakout will be upward or downward.
No. In strong trends, price can keep moving along an outer band for some time. A band touch is only a clue, so you should wait for confirmation from trend, volume, RSI, or MACD.
Riding the bands means price keeps hugging the upper band in an uptrend or the lower band in a downtrend. This usually reflects strong momentum rather than an immediate reversal signal.
Use RSI to confirm whether a band touch is likely to matter. If price reaches the upper band and RSI is above 70, the market may be overbought; below 30 near the lower band may suggest oversold conditions.
MACD can help confirm breakouts and trend strength. For example, after a squeeze, a bullish MACD crossover may support an upside move, while a growing histogram can confirm momentum during a band ride.
Bollinger Bands consist of a middle band, usually a 20-period simple moving average, plus an upper and lower band set around it using standard deviations. Together, they show trend context and changing volatility.
Mean reversion is the idea that price may move back toward the middle band after reaching an outer band. Traders watch for this when price stretches too far and then starts to stabilize.
A common default is a 20-period simple moving average with bands placed two standard deviations above and below it. These settings are widely used, but traders may adjust them for different assets or market conditions.
Avoid placing stops too tightly just outside the bands. Price can briefly move beyond them before returning, so giving the trade more room can help you avoid being stopped out by normal volatility.