Table Of Contents
- What Causes Trends?
- How Do I Identify a Trend on a Chart?
- How Can I Identify and Draw an Uptrend?
- How Can I Identify and Draw a Downtrend?
- How Can I Identify and Draw a Sideways Trend?
- How Long Can a Trend Line Last?
- What Other Indicators Are Best for Spotting Trends?
- How Do Trends Look on Different Timeframes?
- When Should I Enter or Exit a Trend Trade?
- What Are Common Trend-Trading Pitfalls and How Can You Avoid Them?
- How Does Trend Trading Apply Across Assets and Conditions?
- How Do I Build My Own Trend-Trading Strategy?
- Conclusion
Understanding Trends in Trading
Trend Trading is one of the most practical ways to read the market, because it helps you spot whether price is rising, falling, or simply moving sideways. In retail trading, understanding trend direction can mean the difference between following momentum and fighting it. A trend reflects the direction prices move over time. When prices form higher highs and higher lows, you are looking at an uptrend. When they print lower highs and lower lows, it is a downtrend. And when price stays trapped in a range without a clear direction, that is a sideways trend, often called consolidation. In this article, I will explain how to identify each type of trend and why it matters for better trading decisions.
Trends are the backbone of market analysis, defined by sequences of higher highs and higher lows in uptrends, or lower highs and lower lows in downtrends
Sideways trends reflect indecision, where price moves within support and resistance levels, creating range-bound opportunities
Timeframes change how trends appear; what looks bullish on a daily chart can look flat or choppy on an intraday chart
Tools like moving averages, MACD, and RSI help confirm trends, but relying on indicators alone can lead to false signals
Trendlines and channels provide simple visual guides for spotting entry and exit points
Entries often work best on pullbacks within the trend, while exits are guided by trailing stops, profit targets, or reversal signals
Risk management is essential; position sizing, stop-losses, and awareness of economic events keep traders in the game
Combining technical skill with situational awareness transforms trend trading from guesswork into a repeatable strategy
What Causes Trends?
Trends in trading don’t emerge by accident. You need to know that they are the product of:
supply and demand imbalances
shifting macroeconomic conditions, and
fundamental drivers like interest rates, earnings, or commodity prices
Market sentiment and institutional flows add fuel, while herding behavior among traders often extends a move longer than expected.
Trends can also be classified by their duration. Secular trends stretch across decades and define the big picture, while primary trends play out over years.
Secondary or intermediate trends can last weeks to months, giving swing traders their setups, while minor trends are short-term moves that intraday traders try to capture.
No matter the timeframe, spotting the prevailing trend is one of the most important skills in trading. It sets the context for every decision that follows.
How Do I Identify a Trend on a Chart?
You can identify a trend on a chart by reading price action and spotting whether highs and lows are moving consistently up, down, or sideways. The clearest signs come from how price behaves on the screen rather than from any single signal alone. In practice, those repeated movements help define the market’s underlying trend direction.
Uptrend - When you analyze the candlesticks that represent prices, you’ll see prices (represented by candlesticks) trending toward higher highs and higher lows as buyers stay in control.
Downtrend - here, you see the opposite: candlesticks trending downward reveal lower lows and lower highs mark steady selling pressure. When you can connect these points with a simple trendline, the direction often becomes obvious.
Channels - these signifiers take it a step further by showing parallel lines of support and resistance, giving you a visual map within the channels of how far the price can swing before snapping back.
Support and resistance levels - this series of breaks above resistance (upper) levels is a critical marker, while repeated failures at (lower) support levels can mark the beginning of a reversal.
Chart patterns - these help confirm whether a trend is likely to keep going or run out of steam.
We’ve written a highly detailed article about Japanese candlesticks; you can read it here. In that article, you will come to understand visual formations like flags and pennants, for example, which usually signal continuation after a strong move, while double tops or bottoms often warn that momentum is fading.
By combining price action with these tools, you can separate noise from signal and decide whether it makes more sense to follow the trend or prepare for a shift in direction.
In our review of daily and four-hour charts across major forex pairs, indices, and large-cap stocks, the most reliable trend setups were usually the ones where higher highs or lower lows were confirmed by at least one secondary signal, such as rising volume or repeated respect for a trendline over several sessions.
Stay in Control of Your Investments
Build and manage your own portfolio with ease.
Track profits, dividends, gainers, and losers in real time.
Create a custom watchlist for the assets you care about most.
Get live updates on stocks, ETFs, cryptos, and commodities.
Access everything anytime through a sleek, flexible dashboard.
.webp)
How Can I Identify and Draw an Uptrend?
You can identify and draw an uptrend by looking for higher highs and higher lows, then connecting the rising lows with an upward-sloping trendline. This line acts as a visual guide to where buyers are stepping in with strength. Used properly, it helps frame the market’s bullish direction.
Benefit: Trading with an uptrend is simple: you’re moving with the path of least resistance, not trying to conjure a miracle the rest of the market cannot see.
But remember that your potential wins are always tied to the asset type and the specific market conditions. If the asset has a reputation for strength, “buying a dip” during a general uptrend can give you exposure at a discount relative to its usual levels.
How to make money from this: buying dips along that rising trendline gives you better entries while keeping risk under control.
Look at the following image, for example. Let’s say you decided to buy the dip in the S&P500 in March 2020. If you were confident it was a small dip in an otherwise steady uptrend, you could have realized gains of 113% over the next year and a half after buying at a 31% discount.
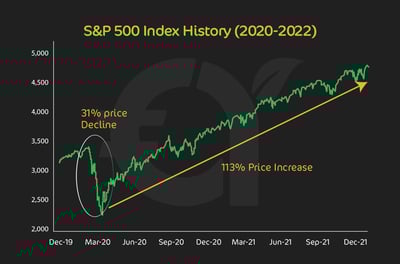
Traders who recognize the structure early can ride the wave for as long as momentum holds, turning what looks like small swings into a string of profitable trades.
How Can I Identify and Draw a Downtrend?
You can identify and draw a downtrend by finding lower highs and lower lows, then connecting the falling highs with a downward-sloping trendline. This line highlights where sellers are consistently taking control. In context, it serves as a guide to the market’s bearish movement.
Benefit: the clearest advantage of trading with a downtrend is that, as with an uptrend, you’re not fighting the market. You’re aligning yourself with the dominant flow of selling pressure, rather than trying to predict a turnaround before it actually happens.
If the market has weak fundamentals or negative sentiment, “selling the rally” can give you better levels than chasing the move after it has sped up.
How to make money from this: shorting rallies near a falling trendline can give you stronger entries with more controlled risk.
Look at this graphic. It shows the point at which you can “sell the rally” during a downtrend, also known jokingly as the “dead cat bounce.”
You might not remember, but Meta Platforms suffered a hellish 2022. It lost roughly 64% of its market value in 2022, falling from around USD 338 at the start of the year to near USD 120 by November.
If you were looking for a “dead cat bounce” during which to sell the rally, that would have been between March and April 2022, according to the image. You would have at least obtained better value for an otherwise tumbling stock.
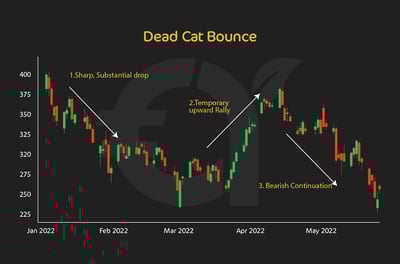
From what I've seen as a trader, those who identify the pattern early can use rally failures and lower highs to plan short entries and manage downside risk more effectively.
How Can I Identify and Draw a Sideways Trend?
You can identify and draw a sideways trend by spotting price moving within a horizontal range, with highs and lows forming around similar levels. This shows the market lacks a clear upward or downward direction. In most cases, the price action reflects consolidation rather than momentum.
To draw it, connect the relative highs with a flat resistance line and the relative lows with a flat support line. This creates a box-like structure that shows where buyers and sellers are evenly matched.
Benefit: The main advantage of trading a sideways market is predictability. You’re not chasing a runaway move but working within a clear trading range where support and resistance levels act like signposts. Instead of fighting momentum, you’re trying to make the most of the pauses between bigger directional moves.
How to make money from this: buying near support and selling near resistance can give you predictable profits if you manage entries with discipline.
Take a look at this graphic, for example. During much of 2015, the EUR/USD currency pair traded sideways within a range of roughly 1.15 to 1.18. Traders who bought at the bottom of the box and sold at the top of the box could have scored a few pips each time without ever needing a breakout.
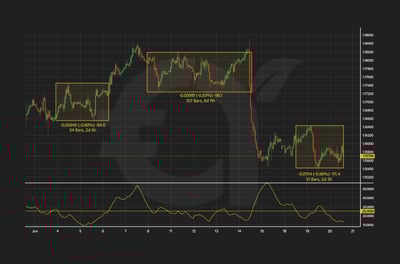
Traders who spot the sideways structure early can take advantage of repetitive patterns, using range-bound setups to generate consistent returns until the market finally chooses a direction.
How Long Can a Trend Line Last?
No trader can predict exactly how long a trend line will last, but you can set realistic expectations by watching price behavior and market context. Its durability depends on how consistently price respects the line over time. In practice, that makes trend strength and conditions more useful than fixed forecasts.
The strength and length of a trend line usually depend on how often price respects it and on the fundamentals driving the market. A trend line that connects three or more swing points is far more reliable than one drawn from a single bounce. The longer it has been in place, the more traders are watching it, which adds to its staying power.
However, the universal truth is that all trend lines eventually break. In FOREX, an uptrend might last weeks if backed by central bank policy shifts, while in stocks, earnings momentum from good product launches can fuel rallies for months.
Commodities and crypto tend to see shorter-lived trend lines because volatility is higher. The benefit of understanding these guidelines is that you don’t chase the trend forever, but use the line as a guide until price action clearly tells you otherwise.
What Other Indicators Are Best for Spotting Trends?
The best other indicators for spotting trends are tools that confirm trend direction rather than replace price analysis. Relying on only one signal in isolation can weaken trading decisions. In practice, traders use added confirmation to strengthen what the chart is already showing.
Moving AveragesSimple moving averages (SMA) and exponential moving averages (EMA) smooth out price action to give you a clearer picture of the underlying trend. A rising 50-day EMA signals momentum is strong, while a 200-day SMA defines the big picture.
If we think of Japanese candlesticks, the famous golden cross (50-day rising above the 200-day) suggests a new long-term uptrend, while the death cross does the opposite.
Momentum Indicators: MACD, RSI, StochasticThe MACD shows both trend direction and momentum through its moving-average crossovers. A bullish crossover above zero tells you definitively that there is an uptrend, while a bearish crossover below zero signals weakness.
RSI helps identify whether a trend is overextended. By reading our comprehensive article on RSI here, you will come to know that readings above 70 suggest overbought conditions, while readings below 30 point to oversold. Stochastic oscillators are similar, highlighting potential pullbacks.
Volume-Based Indicators: On-Balance Volume (OBV) and Volume OscillatorsVolume often moves before price. OBV tracks buying and selling pressure. If the price is flat but OBV is climbing, it hints that buyers are quietly building positions. Volume Oscillators compare short-term vs. long-term volume averages to confirm strength.
How Do Trends Look on Different Timeframes?
Trends look different across timeframes because the same market move can appear clear on one chart and insignificant on another. A move that looks bullish on a daily chart may seem like noise on a five-minute chart. That is why trend context and chart duration both matter when you analyse price action.
- Short-term trends
- Medium-term trends
- Long-term trends
- Very long-term trends
Traders break trends into four broad categories. I discuss them here:
Short-term trends
Minor trends: Short swings visible intraday or over a few sessions, often lasting hours to days. An example of this could be something a scalper watches, a EUR/USD on a 15-minute chart may call a 40-pip rally a trend, even though it’s invisible on the weekly chart.
Medium-term trends
Intermediate trends: These stretch over weeks or months, giving swing traders multiple entry points on pullbacks. Think of a chart showing the price of crude oil grinding higher from $75 to $85 over two months.
Long-term trends
Primary trends: These go on for years and set the broader direction. A classic example of this is the S&P 500 climbing steadily through the 2010s despite short-term volatility.
Very long-term trends
Secular trends: These can last decades, shaped by macroeconomic cycles and institutional flows. A daily chart might show a clear uptrend in Tesla stock, while the hourly chart reveals a choppy sideways consolidation. FOREX traders often use a top-down approach: checking the weekly to define the big picture, then drilling into the four-hour or one-hour chart to time entries.
Commodity traders do the same: wheat might look bullish on the weekly but bearish on the daily. Recognizing that each timeframe tells a different story helps you avoid getting trapped by short-term noise and ensures that your entries line up with the bigger trends.
When Should I Enter or Exit a Trend Trade?
You should enter or exit a trend trade when price gives clear confirmation that the trend is continuing or weakening. Good timing depends less on guessing and more on reading those signals correctly. In practice, that helps traders make more disciplined entries and exits.
Spotting the right entry Clean confirmation signals could look like a moving average crossover, a bullish MACD trigger, or a clean pullback to a rising trendline. Buying into strength after price bounces from support, or shorting after a rejection at resistance, stacks the odds in your favor.
Momentum indicators like RSI or Stochastic help confirm whether the move still has energy, so you’re not chasing a trend that’s already running out of steam.
Here’s an example of how you can spot the right entry. Study the graphic below, which applies to daily timeframes on the DAX 40.
One pattern we repeatedly see during high-volatility sessions around central bank announcements and major earnings releases is that the first breakout or crossover often fails, which is why waiting for the candle close instead of reacting mid-move can reduce false entries.
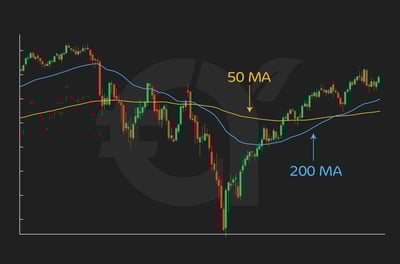
You are tracking the DAX 40, and you see the 50-day moving average sliding under the 200-day moving average. This “death cross” is widely seen as a bearish signal, suggesting that momentum could be shifting to the downside. With the index trading around 2,600, you interpret the crossover as a trigger to short the market by selling futures, for example
Over the following periods, the index does slip lower, confirming the bearish stance. But instead of a sustained downtrend, buyers slowly return. Prices stabilize, volatility narrows, and the 50-day average begins to curve upward. Eventually, it climbs back through the 200-day line, creating a “golden cross” that signals renewed bullish strength. The DAX 40 is now trading near 2,800.
At this point, you would exit your short, banking profits from the earlier decline, and flip your position long. You see the second crossover as confirmation that momentum has shifted back in favor of the bulls, with the potential for the index to rally toward fresh highs.
In this way, you are first triggered to sell when the 50-day sinks beneath the 200-day, and then triggered again to buy once the 50-day climbs back above it. Each crossover is a clear technical signal to adapt to the changing market trend on the DAX 40 daily chart.
Planning your exitExits are just as critical as entries. A trailing stop lets you secure profits while leaving room for the trend to continue. Setting profit targets at the edge of a trend channel is another disciplined way to lock in gains.
If an indicator shows a reversal, such as MACD crossing against you or a double top forming, that’s usually your cue to step aside.
Managing riskRisk control ties the strategy together. Never risk more than your account can handle on a single trade. Position sizing, a consistent risk-to-reward ratio, and the discipline to avoid overtrading ensure you stay in the game long enough for trend-following math to work in your favor.
Remember that false breaks are part of trading, which is why backtesting and demo practice are vital. They help filter weak entries and refine your system before real money is on the line.
By combining smart entries, disciplined exits, and strong risk management, you can transform trend trading from guesswork into a repeatable strategy.
What Are Common Trend-Trading Pitfalls and How Can You Avoid Them?
Common trend-trading pitfalls usually come from relying too heavily on tools without enough market context. You can avoid them by combining technical skill with stronger situational awareness. That balance helps reduce repeated trading mistakes when following trends.
Don’t rely on lagging indicators
Tools like moving averages often give signals after much of the move has already passed. By the time a crossover flashes, the price may already be extended.
Solution: combine indicators with price action and volume to avoid chasing late entries.
What do to in choppy, sideways markets?
What looks like a breakout can quickly reverse. This creates false signals and whipsaws.
Solution: Use multiple timeframes to confirm direction and filter out noise.
Beware of relying on a single indicator
Example: a trend confirmed by MACD but contradicted by RSI should be a warning, not a green light.
Solution: look for convergence among tools rather than dependence on a single one.
Watch for macro shocks
Even clean charts can be overturned by central bank decisions, geopolitical events, or surprise data.
Solution: always check the economic calendar, be aware of key events, and size positions to withstand volatility.
How Does Trend Trading Apply Across Assets and Conditions?
Trend trading applies differently across assets and market conditions because each market behaves in its own way. In FOREX, major pairs like EUR/USD often show smoother, longer-lasting trends due to deeper liquidity, while exotic pairs can be more erratic. As a result, adapting to market conditions is essential.
Equities and indices are primed to respond strongly to earnings, economic cycles, and sentiment shifts, making moving averages and volume indicators highly useful in this case. Commodities, on the other hand, trend on supply/demand shocks and seasonality, where longer-term charts help filter out noise.
Crypto is the most volatile of the group, with trends that can flip overnight. Here, momentum tools like MACD or RSI tend to work better than slower-moving indicators.
It’s worth noting, though, that markets aren’t always trending. In range-bound conditions, trend-following strategies will bleed from repeated false starts. That’s when patience and adaptability matter.
Some traders step aside until a breakout confirms a new trend, while others switch to range tactics, such as buying support and selling resistance. Recognizing when the environment has shifted is as important as spotting the trend itself.
Across assets and conditions, the principle stays the same: align your strategy with the market you are trading, not the one you wish you were trading.
How Do I Build My Own Trend-Trading Strategy?
Building a trend-trading strategy is about finding the right mix of tools that matches your style. Here’s a handy list of actions that can help you answer the question, “How Do I Build My Own Trend-Trading Strategy?”
Choose your tools
Building a trend-trading strategy is about finding the right mix of tools that matches your style.
- Choose your tools: Some traders rely on moving averages and MACD to confirm direction. Others prefer price action with trend lines and channels. The key here is to combine a few reliable signals into a repeatable setup.
- Backtest your framework: Run your rules across months or years of historical charts. This shows whether your idea works in different market conditions.
- Test in a demo account: Trade your setup live without risking real money. Refine entries and exits, and identify gaps in your plan. Many strategies look perfect on paper but need tweaks in real-time trading.
- Keep a trading journal: Record why you entered, how you managed risk, and why you exited. Journaling reveals patterns in your behavior, both strengths and weaknesses. Reviewing notes helps you adapt and improve over time.
Backtest your framework
Run your rules across months or years of historical charts. This shows whether your idea works in different market conditions.
Test in a demo account
Trade your setup live without risking real money. Refine entries and exits, and identify gaps in your plan. Many strategies look perfect on paper but need tweaks in real-time trading.
Keep a trading journal
Record why you entered, how you managed risk, and why you exited. Journaling reveals patterns in your behavior, both strengths and weaknesses. Reviewing notes helps you adapt and improve over time.
A trend trading system doesn’t appear overnight; it’s built through testing, practice, and discipline. When refining trend-following frameworks, I’ve found that reviewing 20 to 30 demo or backtested trades is usually enough to expose recurring mistakes, especially entries taken too far from the trendline or exits cut early after normal pullbacks.
Conclusion
Trend Trading becomes much easier when you learn to read price structure, trendlines, channels, and support and resistance together. Whether the market is forming an uptrend, downtrend, or sideways range, the goal is to understand who is in control and trade with that context in mind. The more consistently you identify the prevailing trend, the better your decisions become. Study charts regularly, practice marking trend direction clearly, and wait for strong confirmation before entering a trade. Over time, this simple discipline can help you filter out noise and approach the market with more confidence.
FAQ
A trend is the overall direction price moves over time. An uptrend forms higher highs and higher lows, a downtrend forms lower highs and lower lows, and a sideways trend stays inside a range.
A strong trend usually shows clean price structure, repeated respect for the trendline, and support from indicators or volume. The more often price confirms the move without breaking structure, the more reliable it tends to be.
The best timeframe depends on your trading style. Short-term traders use intraday charts, while swing traders and investors focus on daily, weekly, or monthly charts. A top-down approach helps align entries with the bigger trend.
A pullback is a temporary move against the main trend, while a reversal means the trend itself may be changing direction. Watching whether the existing pattern of highs and lows remains intact helps you tell them apart.
Yes, sideways markets can be traded by buying near support and selling near resistance. If the range breaks convincingly, some traders stop range trading and switch to breakout setups instead.
Popular trend tools include moving averages, MACD, RSI, Stochastic, and volume indicators such as OBV. They work best when combined with price action instead of being used alone.
Yes, major events like central bank decisions, earnings releases, and geopolitical shocks can strengthen, weaken, or reverse a trend quickly. Checking the economic calendar helps you manage that risk before entering.
A safer approach is to backtest your rules on historical charts, then practice in a demo account before risking real money. Keeping a trading journal helps you improve entries, exits, and risk control over time.
Start with price structure. Higher highs and higher lows point to an uptrend, lower highs and lower lows signal a downtrend, and flat support and resistance usually indicate a sideways market.
Entries are often strongest after confirmation, such as a pullback holding support, a rejection at resistance, or an indicator crossover that matches the price structure. The goal is to avoid chasing a move that is already stretched.
Exits usually make sense when the trend structure breaks, a reversal signal appears, or your trailing stop is hit. Some traders also take profit near channel boundaries or other planned target levels.