Portfolio 360° Tracker - Start Your Free Portfolio Tracker
You can't manage what you can't see. Track stocks, ETFs, crypto, and any asset — your complete portfolio in one view. Built for serious investors. Free to start.
No credit card required
- +100 K
- Investor
- +10,000
- Assets
- +100
- Broker Connect
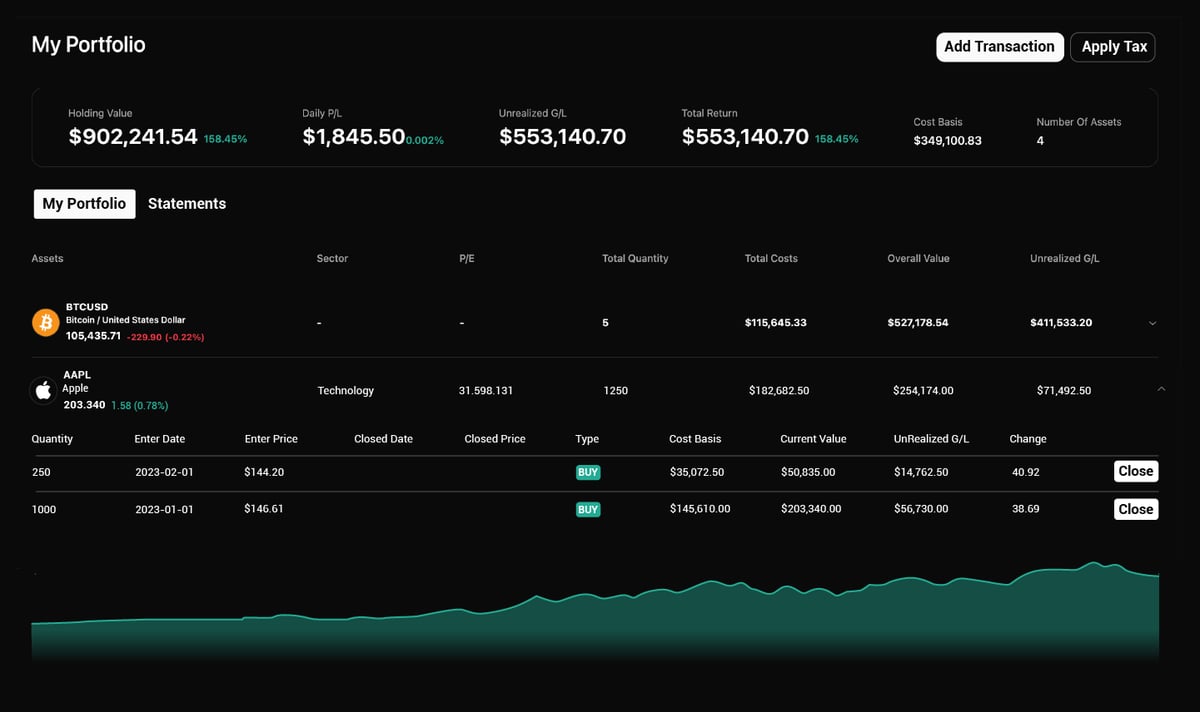
Your Real Return
Realized, unrealized, dividends, fees and taxes in one number — open and closed.
Beating the S&P?
True time-weighted return, measured against the S&P 500 and Nasdaq.
Dividends, Forecast
Every payout and yield recorded, plus projected income for next year.
AI Tax Assistant
Capital gains under your country's rules, guided by AI.
11 Reports
11 reports show what built your return, and what quietly drained it.
See Portfolio Tracker 360° in Action
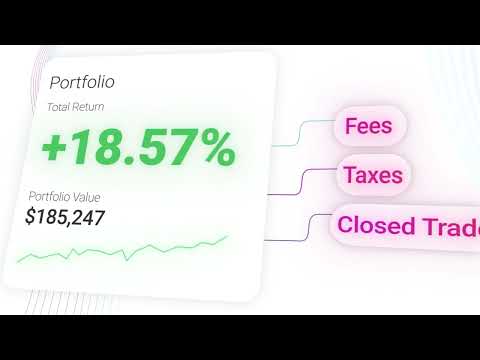
Track Thousands of Stocks,
ETFs, Cryptos in One Minute
No more spreadsheets to update by hand.
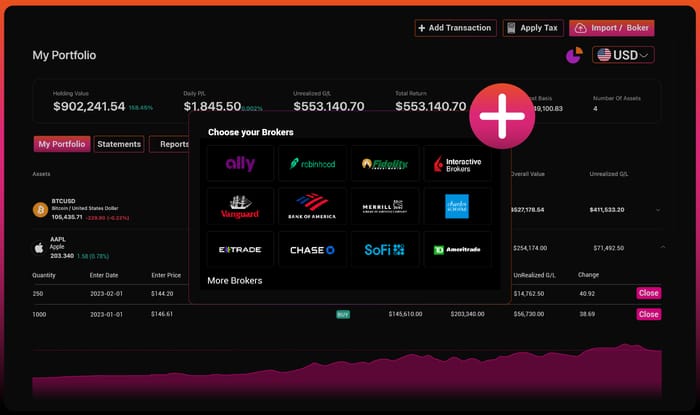
Choose your broker
You'll sign in on your broker's own site. We never see your credentials.
Connect your broker
Link it once. Holdings and trades import themselves, then keep syncing.







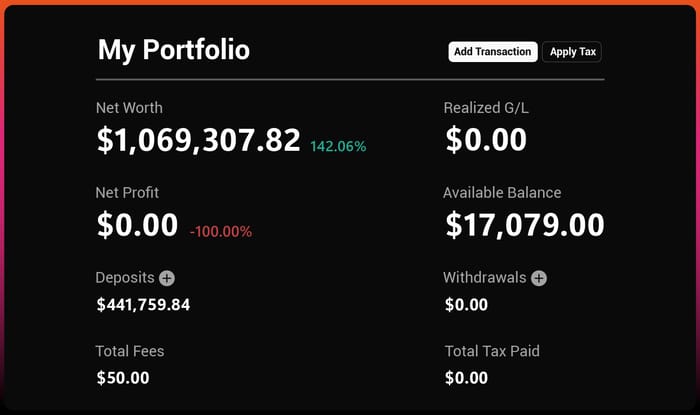
Portfolio 360°: Zero Blind Spots
Born from a need no tool could solve, Portfolio 360° is the product we built an entire company — Arincen — around. Every deposit, fee, dividend, profit, and closed position is captured in real time, down to the last detail. A portfolio tracker with zero blind spots — the complete picture of your wealth.
Five numbers make up your return. Your broker shows you one.
Realized P&L, unrealized P&L, dividends, fees, taxes — stacked into one net total return, each bar drilling down to the trade behind it.
Realized +18.4K and unrealized +26.9K read like a +45.3K year. Add 3.2K dividends, subtract 1.2K fees and 4.5K tax: the real figure is 42.8K. That 2.5K already left your account.
Deposits and withdrawals feed net worth separately — cash you moved, not return you earned.
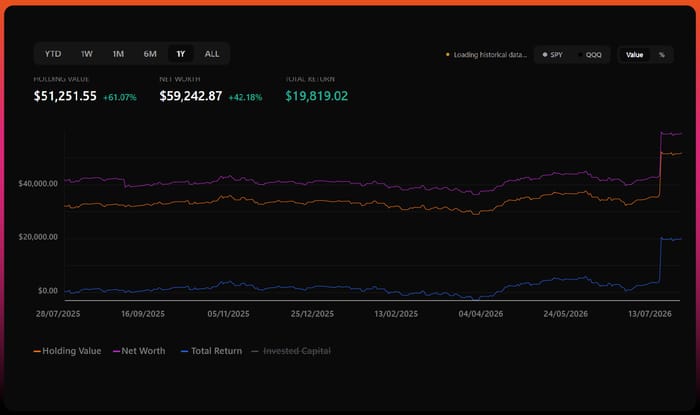
Your return against the S&P 500 — measured the way funds measure it.
Deposit in March and again in July and a simple percentage return flatters you: it credits your timing, not your picks. Time-weighted return strips deposits and withdrawals out. That's why funds report it.
Arincen plots yours against the S&P 500 and Nasdaq on one axis, across YTD, 1W, 1M and more. Trailing the index shows immediately, and Contribution Analysis breaks the gap down holding by holding.
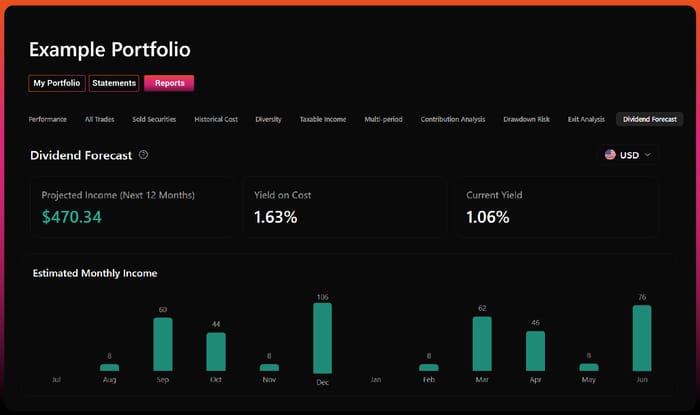
Dividends: what you've collected, and what's coming.
Every payout logged with date, gross amount and tax withheld — no rebuilding it from statements in April.
Per holding: current yield and yield on cost. Across the portfolio: income to date, plus projected income for next year at current declared rates. Upcoming payouts appear on a calendar before they pay.
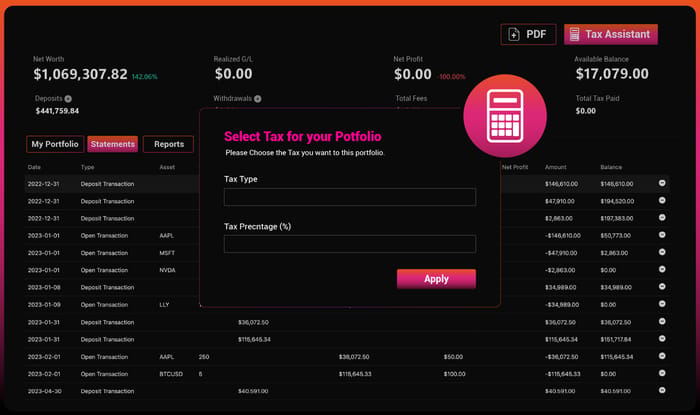
Withheld tax feeds straight into the Tax Assistant.
Capital gains under your own country's rules — 37 of them.
A holding period that's tax-free in one country is fully taxable in the next.
The AI Tax Assistant applies your country's rules — 37 supported — to your real trade history: taxable income, capital gains, losses to carry forward, refunds owed. It updates as you trade.
Overpaid dividend withholding tax can often be reclaimed from 1 month up to 2 years after you sold. Arincen flags those windows before they close.
Not tax advice.
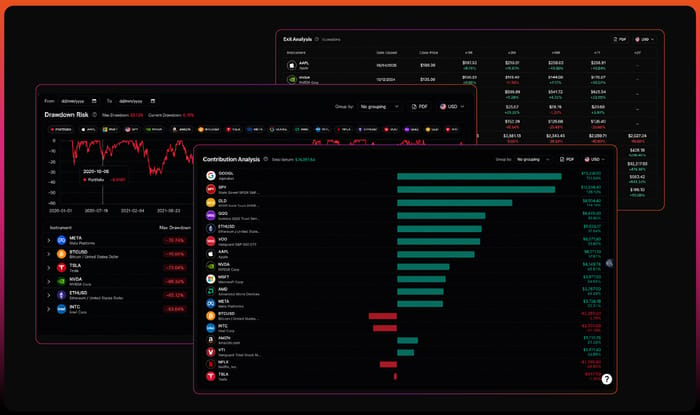
11 reports, and the questions they answer.
"What happened to that stock after I sold it?" → Exit Analysis
"I'm down 18%. How long until I'm back?" → Drawdown Risk
"What dividend income can I count on next year?" → Dividend Forecast
8 more cover your return against the S&P 500, contribution, multi-period, diversity, cost basis, every trade, closed positions and tax. Each exports to PDF in one click — the version you send an accountant.
Read-only by design. We never see your password.
You sign in on your broker's own site — Arincen never receives your credentials. The connection is read-only: holdings and trades sync in, orders can never be placed out. Disconnect anytime.
No broker? Upload a CSV (.csv or .txt, up to 2 MB). Every row is validated before it saves; duplicates and bad rows are flagged and skipped.
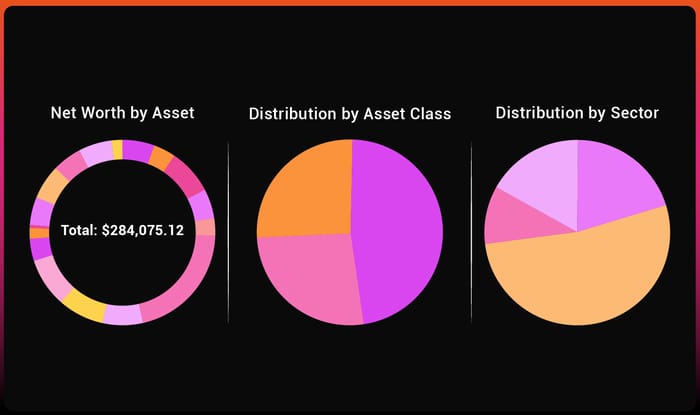
Today's movers, and where your money actually sits.
Open Portfolio Statistics and the day's gainers and losers are ranked before you've scrolled.
Underneath: Net Worth by Asset, Distribution by Asset Class, and Distribution by Sector — three views of the same portfolio, so a position that's quietly become 40% of your book is obvious rather than something you work out later.
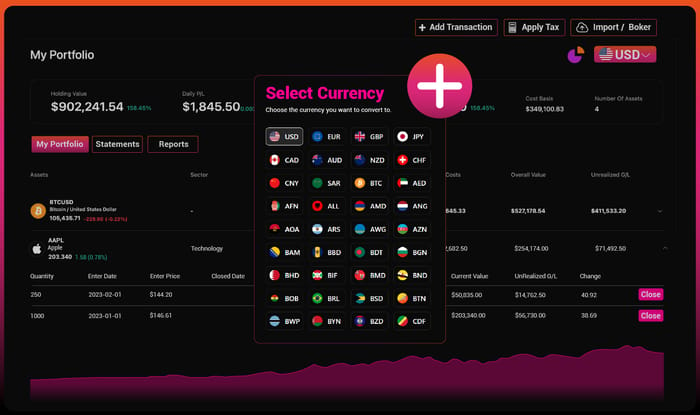
Every figure in the currency you think in.
Switch tracking currency from the portfolio header and every number converts at once — holdings, P&L, dividends, fees and tax.
100+ currencies. Hold assets across several markets and still read one consistent set of numbers, without converting anything in your head.
Unlimited Possibilities
Track your investments in any currency, connect with thousands of traders, and manage a wide range of assets in one place.
+ 100 Currencies
Track your investments in your local currency
+ 100 K Investors
Connect to more than 100,000 traders
+ 10,000 Assets
Add any asset to your portfolio
Track On the Go
Monitor your portfolio in real time, wherever you are. Stay updated, make quick decisions, and never miss a beat.






Create Your First Portfolio Tracker Absolutely Free
Start building your investment journey today at zero cost. Easy setup, powerful tools, and total control from the first click.
Try It NowGot Questions?
Here's what investors ask us most — answered clearly.