Table Of Contents
- What Is the History of RSI?
- What Is the RSI Indicator?
- How Does RSI Work?
- What Are the Most Common RSI Trading Signals?
- How Does RSI Help Identify Market Momentum?
- How Is RSI Applied in Real Trading?
- Should You Combine RSI With Other Indicators?
- How Does RSI Work in Live Examples?
- What Are the Best RSI Tips for Beginners?
- What Common RSI Mistakes Should You Avoid?
- Conclusion
The Trader’s Guide to Using the Relative Strength Index
RSI Indicator, also known as the Relative Strength Index, is one of the most useful tools for understanding market momentum and spotting potential trading opportunities. If charts and candlesticks feel overwhelming, RSI offers a simple way to see whether a market may be overbought or oversold. In this article, I’ll break down how RSI works, what key levels like 30, 50, and 70 mean, and how traders use it alongside tools like Bollinger Bands and Fibonacci retracements to make smarter trading decisions.
RSI is a momentum oscillator ranging from 0 to 100 that helps traders identify overbought conditions above 70 and oversold conditions below 30.
The indicator calculates momentum by comparing average gains to average losses over a set period, 14 periods is the default.
Readings above 70 suggest a potential reversal or profit-taking phase, while readings below 30 may signal a buying opportunity.
Midline crossovers around 50 can confirm trend direction, with a move above indicating bullish momentum and below indicating bearish momentum.
Bullish divergence occurs when price makes a lower low but RSI forms a higher low, hinting at weakening downside momentum.
Bearish divergence happens when price records a higher high while RSI posts a lower high, flagging a possible trend reversal.
RSI delivers its best signals when used alongside tools like moving averages, Bollinger Bands, MACD, or Fibonacci levels to reduce false alarms.
Effective RSI use includes adjusting its period length to match your trading timeframe, avoiding over-reliance on single signals, and pairing stop-loss levels with technical support or resistance.
What Is the History of RSI?
The RSI was developed by J. Welles Wilder Jr. in the late 1970s to help traders measure market momentum. It was quickly adopted by the trading community and became a core part of technical analysis. Traders valued it because it helped identify overbought and oversold conditions with greater clarity.
.webp)
The reading is easy to understand, as I will explain, and is also pretty accurate. After its introduction, RSI became a standard across global financial markets. It works across all financial assets. Whether it is stocks, FOREX, commodities, or even cryptocurrencies.
Traders rely on the RSI to gauge market sentiment and fine-tune their strategies. The versatility of the tool, as well as how easy it is to use, has solidified RSI’s place in the toolbag of many traders. Let our Arincen experts tell you why.
What Is the RSI Indicator?
The RSI indicator is a momentum oscillator that measures buying and selling strength on a 0–100 scale. It does this by comparing the average of recent price gains with the average of recent price losses over a set period. In most cases, that period is 14 days.
A reading above 70 suggests that an asset could be overbought, and therefore primed for a downward correction. On the other hand, a reading below 30 hints at an oversold market, signaling a potential upward bounce. Naturally, any reading between these two extremes should be viewed as inconclusive. However, these midway readings are still useful, as they can confirm trends. A move above the midpoint of 50 generally supports an upward trend, while a drop below 50 suggests a downward trend. We can therefore see how this straightforward scale is for traders.
One of the best things about RSI is its flexibility. Even though 14 days is the most common timeframe, you can apply it across various timeframes. It doesn’t matter if you are trading on a 1-minute chart or analyzing weekly trends.
As I’ve also noted, RSI works seamlessly across different asset classes. This adaptability makes RSI a favorite among traders who want a simple way to inform their strategies and stay ahead of market trends.
How Does RSI Work?
RSI works by comparing recent price gains with recent price losses to measure momentum over a chosen period. The formula converts that comparison into a value on a 0–100 scale. This helps traders judge whether market buying or selling pressure is becoming stronger or weaker.
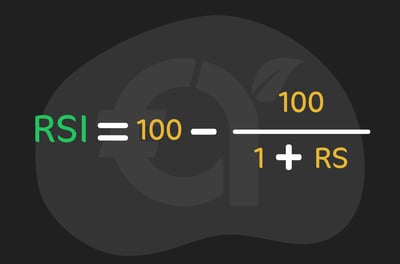
Where RS stands for the relative strength, which, as we know, is the ratio of average gains to average losses over a set period. By using this formula, you can transform raw price data into a clear, actionable metric on a scale of 0 to 100. Anyone worried about doing these calculations themselves needn’t worry, as all of the best broker provide RSI readings on their platforms.
I’ve said RSI is flexible, but it is also highly sensitive. Its reading is adept at sensing both price gains and losses, giving you a balanced view of market momentum. By combining simplicity with precision, RSI helps you spot shifts in market behavior, whether you’re watching for reversals or riding established trends.
In our review of multiple chart setups across stocks, forex, and crypto over the past 12 months, RSI was usually most reliable when momentum signals were confirmed by price structure rather than used in isolation.
What Are the Most Common RSI Trading Signals?
The most common RSI trading signals are signals that help traders spot reversals, corrections, and trend confirmation. These signals are straightforward but powerful when used correctly in trading decisions. That is why the RSI remains a go-to tool for many traders.
Overbought Conditions
In my experience, overbought conditions occur when an asset's price rises significantly in a short period. A telltale sign that an asset is overbought is when its price exceeds its intrinsic or market-accepted value.
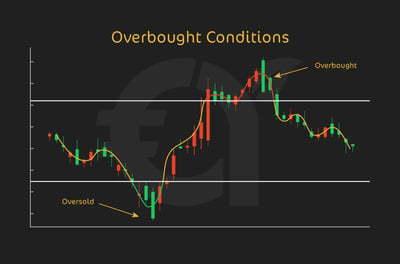
This short-term overperformance is often referred to as a “bubble,” driven by emotional buying when technical indicators suggest it is unsustainable. At times like these, the asset is often overvalued by frenzied demand and could be due for a correction or pullback.
When using RSI to guide your decision, watch out for when the value crosses above 70. This is a strong suggestion that the market might be overbought. Now could be a good time to be alert for selling opportunities or for you to tighten stop-loss levels.
Oversold Conditions
Oversold conditions suggest the asset is undervalued and might be primed for a rebound or price recovery. In times like these, an RSI reading below 30 often signals that the asset is oversold. It’s typically a sign of a buying opportunity, but just remember that this doesn’t guarantee an immediate price reversal.
Why? Well, in some cases, the asset's downward momentum might even continue. In fast-moving sessions around major economic releases or earnings announcements, I’ve often seen RSI stay below 30 for longer than newer traders expect, which is why confirmation from price action or support levels matters before entering.
Divergences
Divergences happen when the movement of an asset and the RSI indicator don't align. This is a warning of a possible reversal or a continuation of a trend. There are two main types of divergences:
Bullish Divergence: This happens when the price of an asset makes a lower low, but the RSI forms a higher low. It could mean a weakening downward momentum and a potential trend reversal to the upside. You would not be wrong to view this as a buying opportunity, especially when the RSI is below 30 and near oversold levels below 30.
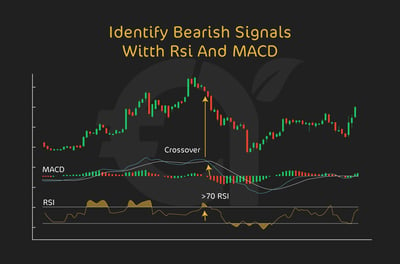
Bearish Divergence: This happens when the price of an asset makes a higher high, but the RSI indicates a lower high. This is likely because of weakening upward momentum which could mean a potential reversal to the downside. If these conditions occur, it could be a good time to consider selling or tightening stop-loss levels.
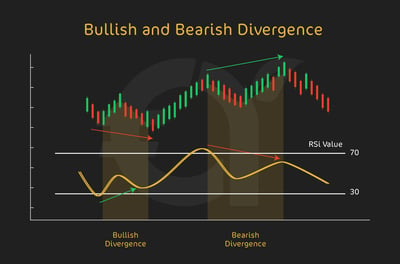
Divergences are useful for spotting trend exhaustion or hidden market strength. As always, they work best when confirmed by other technical indicators, as they don’t always guarantee a reversal.
Centerline Crossover
A centerline crossover in the context of RSI refers to when the RSI value passes above or below the midpoint of its scale, which lies at 50. This crossover is a good way to confirm the direction of the momentum that the asset is enjoying.
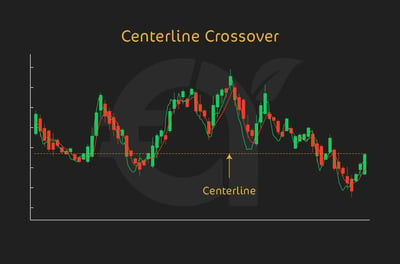
A bullish centerline crossover typically occurs when the RSI crosses above 50, signaling that buying momentum is increasing and the asset may be heading into an uptrend. A bearish centerline crossover is when the RSI falls below 50. This often means that selling momentum is increasing and the asset might be heading into a downtrend.
How Does RSI Help Identify Market Momentum?
RSI helps identify market momentum in several practical ways:
- Spotting overbought and oversold levels: Knowing when an asset might be overbought (above 70) or oversold (below 30) is crucial to making informed, winning trades.
- Identifying divergences: Divergences can reveal hidden shifts in market momentum. A bullish divergence tells you that selling pressure is weakening, while a bearish divergence suggests fading buying momentum. These signals are invaluable for anticipating reversals.
- Centerline crossover: A centerline crossover is a straightforward yet powerful momentum indicator. Once you know whether a trend is bullish or bearish, this crossover helps you align with the prevailing trend rather than betting against it.
- Using RSI with other indicators for confirmation: One thing to know about every technical indicator is that none is foolproof. Indicators simply show how an asset’s price is behaving. To improve accuracy, always pair RSI with tools such as moving averages, Bollinger Bands, or Fibonacci retracements.
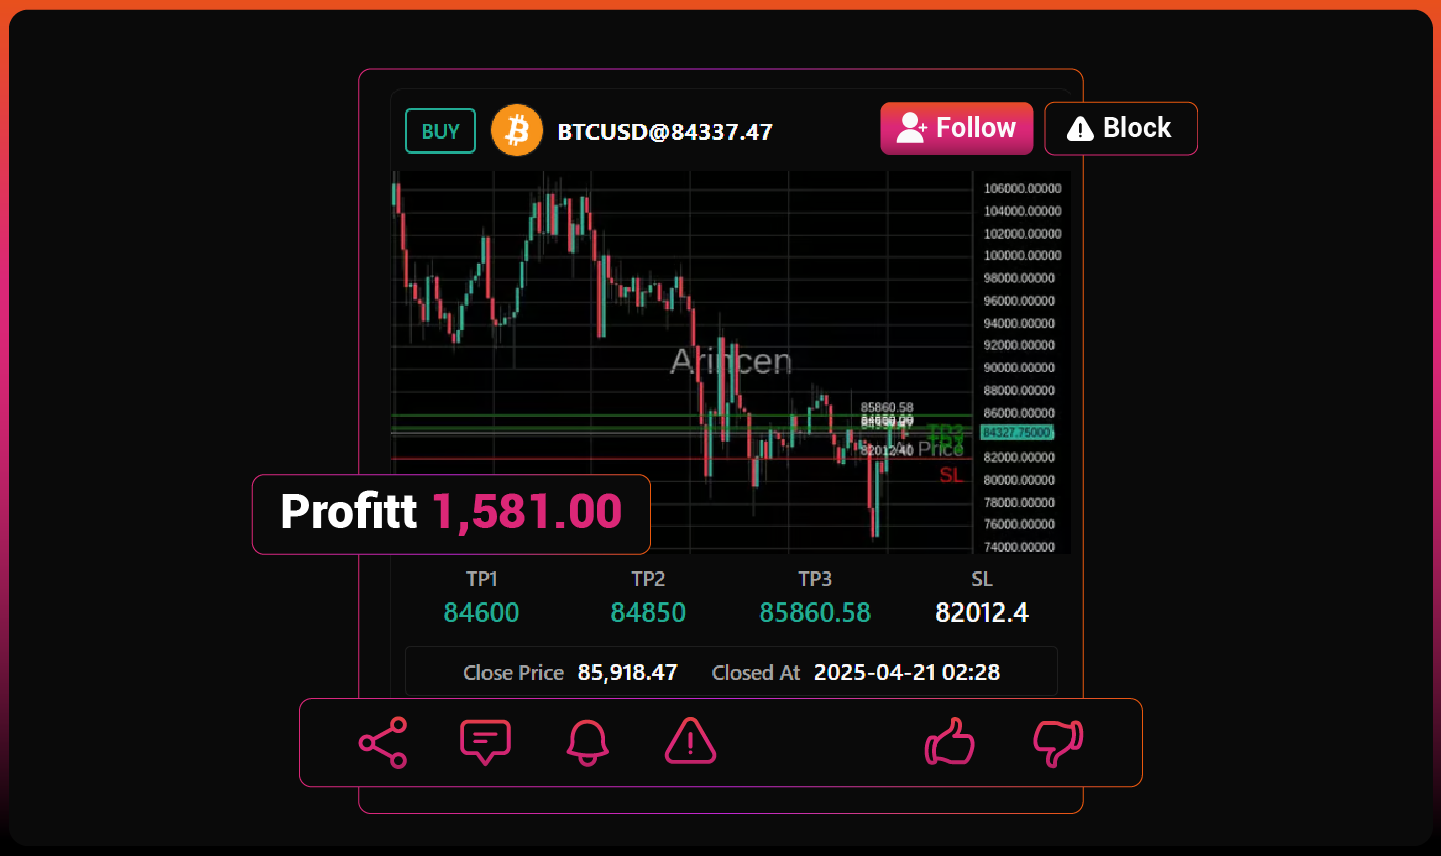
Trade with Real-Time Expert Signals
Follow live signals from experienced traders.
Get entry price, TP levels, SL, and closure updates.
Receive instant alerts when targets or stops are hit.
Track performance with clear, transparent stats.
Stay aligned with the market in real time.
How Is RSI Applied in Real Trading?
RSI is applied in real trading in a few practical ways:
- Entry and exit points: RSI helps you figure out when to enter or exit trades. As I’ve said, any time you get an RSI near 30, you should view it as a buying opportunity during a downtrend. Similarly, a reading above 70 can help you manage an open position by signaling when to lock in gains or tighten stop-loss orders.
- Risk management: RSI also helps you set stop-loss levels that make sense. By identifying overbought or oversold zones, you can place stops beyond these levels, protecting your positions from sharp reversals while giving your trades room to develop. This is the crux of good risk management.
- Pre-trade confirmation: In practice, I’ve found RSI most useful when it is part of a pre-trade checklist, especially on short-term charts where waiting for both an RSI trigger and a clear support or resistance reaction helps reduce impulsive entries.
Should You Combine RSI With Other Indicators?
Yes, traders should combine RSI with other indicators because doing so can confirm signals and improve decision-making. Common pairings include:
- RSI and Moving Averages: Combining the RSI with moving averages can provide a clearer view of market trends. If the RSI crosses above 70, showing overbought conditions, but the price remains above its 20-day or 50-day moving average, it suggests that the trend could still be strong. Moving averages help determine whether the RSI signal is consistent with the overall market direction or a passing fluctuation.
- RSI and Bollinger Bands: Bollinger Bands measure price volatility, while RSI gauges momentum. If RSI falls below 30 and the price touches the lower Bollinger Band at the same time, this confirmation strengthens the idea that an upward correction is on the cards. Similarly, if RSI is above 70 and the price hits the upper Bollinger Band, a pullback might be on the way.
- RSI and MACD: The Moving Average Convergence Divergence (MACD) is a powerful tool for confirming the strength and direction of trends. When RSI reveals overbought or oversold conditions, checking the MACD histogram or signal line crossover can often confirm the signal. If RSI suggests an upward reversal but MACD shows falling momentum, you would be advised to wait for stronger confirmation before entering the trade.
- RSI and Fibonacci Retracements: Fibonacci retracements are powerful mathematical signals that can help identify support and resistance levels. If RSI plummets under 30 and the price approaches a key Fibonacci retracement level, this pairing can mean a high probability buy opportunity. In the same vein, combining an overbought RSI with a price approaching a resistance level strengthens the case for a sell trade.
RSI and Fibonacci RetracementsFibonacci retracements are powerful mathematical signals that can help identify support and resistance levels. As we know, RSI reveals the strength of price movements. Taken together, if RSI plummets under 30 and the price approaches a key Fibonacci retracement level, this pairing can mean a high probability buy opportunity. In the same vein, combining an overbought RSI with a price approaching a resistance level strengthens the case for a sell trade.
How Does RSI Work in Live Examples?
In live examples, RSI helps traders spot opportunities, manage risk, and make timely decisions in changing markets. It can be used to identify reversals, confirm trends, and act on divergences. This makes it a versatile tool for handling dynamic market conditions.
Overbought Signal Leading to a ReversalIn our first example, imagine a tech stock that has been on a solid uptrend, with its RSI rising to a reading above 70. By now, you know that is an overbought condition, suggesting the stock rally might be losing steam. Not long after, the stock price starts to flatten, and a bearish candlestick pattern shows up. This is a classic setup for a price reversal. A smart trader would use this signal to exit long positions or consider shorting the stock, as it suggests a downward correction.
Bullish DivergenceLet’s say you are trading gold and its price experiences a sharp decline. While the price forms lower lows on the chart, the RSI begins forming higher lows, meaning that a bullish divergence is at play. This suggests that selling momentum is getting weaker, even though the price is still falling. As soon as you see this divergence, you could take a long position, anticipating a reversal. As the price stabilizes and moves higher, you can cash in.
Centerline BreakoutNow, take the case of a cryptocurrency like Bitcoin recovering from a bearish trend. As the price stabilizes and starts rising, the RSI crosses above the 50 level. From what you know, this centerline breakout confirms a shift in momentum from bearish to bullish. You could use this signal to enter a long position, riding the new uptrend.
What Are the Best RSI Tips for Beginners?
The best RSI tips for beginners are easier to follow when presented as clear actions:
- Adjust RSI settings for different markets and timeframes: The default RSI setting of 14 days works well for many traders, but markets and strategies can be different. For those who like a faster-paced environment, like day trading, a shorter period of perhaps 7 or 9 days can give you quicker signals. On the other hand, longer periods (e.g., 20 or 30 days) offer smoother signals for swing traders or position traders. I advise experimenting with settings to tailor RSI to the asset and timeframe you’re trading.
- Don’t rely on RSI alone: RSI is a valuable indicator, but it works best as part of a broader strategy. Pair it with tools like moving averages, Bollinger Bands, or Fibonacci retracements to build a more complete trading setup around RSI signals. For example, if RSI suggests an oversold condition, confirm the signal by checking for support at a Fibonacci level or watching for a reversal candlestick pattern.
- Manage your risk better with stop-loss levels: Protect yourself by setting stop-loss orders at logical levels. For instance, when entering a trade based on RSI’s oversold signal, it’s a good idea to put your stop just below a recent support level. This limits potential losses if the market keeps moving against your position. You need a disciplined risk-management approach so no single trade significantly impacts your overall performance.
What Common RSI Mistakes Should You Avoid?
Common RSI mistakes to avoid include misreading signals, ignoring context, and making poor trading decisions from limited information. Knowing these errors can help traders use the indicator more effectively. It also reduces the risk of avoidable mistakes in market analysis.
Misinterpreting overbought/oversold conditions as guaranteed reversalsOne of the most common mistakes traders make is assuming that an RSI reading above 70 or below 30 always signals a reversal. While these levels show underlying overbought or oversold conditions, they are not foolproof predictors.
During strong trends, RSI can remain above 70 or below 30 for extended periods. For example, in a strong uptrend, RSI might hover above 70 without the price reversing. Don’t act hastily and do look for additional confirmation, such as divergence or candlestick patterns, before entering a trade.
Ignoring divergences and other key RSI signalsDivergences are a crucial aspect of RSI, yet many traders overlook them. For instance, a bullish divergence—where RSI forms higher lows while the price makes lower lows—can signal weakening bearish momentum and a possible reversal.
Likewise, bearish divergence, where the RSI forms lower highs while the price makes higher highs, could signal a possible downtrend. If you ignore these signals, you could be missing significant trading opportunities. Always analyze the full RSI picture, including divergences and centerline crossovers, to sharpen your decision-making.
Overcomplicating trades with tight stop-loss settings based only on RSIAnother common pitfall is setting very tight stop-loss orders based solely on RSI signals. For example, you might put a stop-loss just outside the 70 or 30 levels, assuming the price won’t cross either level.
However, as we all know, markets are unpredictable, and brief spikes beyond these levels can lead to unnecessary stop-outs before the trade has a chance to play out. Instead, make sure your stop-loss levels are in sync with key support or resistance levels, giving your trades room to breathe while managing risk at the same time.
Conclusion
RSI Indicator can be a powerful way to measure momentum, spot overbought and oversold conditions, and confirm broader market trends. When you understand key levels such as 30, 50, and 70 and combine the Relative Strength Index with tools like Bollinger Bands or Fibonacci retracements, you give yourself a stronger framework for making informed trades. Use RSI as part of a broader strategy, not as a standalone signal. Practice on different timeframes, test it across assets, and refine your approach so you can trade with more confidence and discipline.
FAQ
The RSI is a momentum indicator used in technical analysis to measure the speed and change of price movements. It works on a scale of 0 to 100, helping you to see overbought or oversold conditions in the market.
An RSI below 30 indicates that an asset is probably oversold, which tells you there is a potential buying opportunity. An RSI above 70 suggests that an asset could be overbought, meaning it might be time to sell. However, these levels are not guaranteed and should be used alongside other indicators.
Yes, RSI is often combined with moving averages, Bollinger Bands, MACD, or Fibonacci retracements. Using confirmation from multiple tools can reduce false signals and give a clearer view of trend direction and timing.
A bullish divergence occurs when the price makes a lower low while RSI forms a higher low, indicating weakening downward momentum and a potential upward reversal. A bearish divergence happens when the price makes a higher high, but RSI shows a lower high, signaling fading upward momentum and a possible downward reversal.
RSI helps traders identify potential entry and exit points by highlighting overbought or oversold conditions. For example, an RSI below 30 during a downtrend could signal a buying opportunity, while an RSI above 70 in an uptrend could suggest it’s time to sell or tighten stop-loss levels.
Yes, the default 14-day RSI setting can be adjusted. Shorter periods (e.g., 7 or 9 days) offer quicker signals that are suitable for day trading, while longer periods (e.g., 20 or 30 days) provide smoother signals for swing or position trading.
Assuming overbought/oversold levels always guarantee reversals, especially during strong trends. Ignoring divergences, which provide critical insights into market momentum. Setting overly tight stop-loss levels based solely on RSI, can lead to premature exits during market fluctuations.
RSI, or Relative Strength Index, is a momentum indicator that measures the speed and strength of recent price moves on a scale from 0 to 100. Traders use it to spot overbought, oversold, and trend-strength conditions.
A reading below 30 suggests an asset may be oversold, while a reading above 70 can signal overbought conditions. These levels are warnings, not guarantees, so traders should confirm them with price action or other indicators.
The default RSI setting is 14 periods, and it works well for many markets. Shorter settings like 7 or 9 react faster, while longer settings like 20 or 30 produce smoother signals for swing or position trading.
Traders often look for potential buys when RSI drops below 30 and possible sells when it rises above 70. Many also use the 50 level to confirm momentum direction before entering or exiting a trade.
An RSI divergence happens when price and the indicator move in different directions. This can show weakening momentum and may warn of a possible reversal, especially when combined with other confirmation signals.
The 50 level acts as a centerline for momentum. When RSI moves above 50, it can support a bullish trend, and when it falls below 50, it can point to growing bearish momentum.
RSI can work for both day trading and swing trading because it adapts to different timeframes. The key is adjusting the period setting to match your strategy, market, and how quickly you want signals to appear.
Common mistakes include treating overbought or oversold readings as guaranteed reversals, ignoring divergences, and setting stop-loss orders too tightly based only on RSI. The indicator works best as part of a wider trading plan.