Table Of Contents
- What Are Trading Channels?
- Why Are Trading Channels Useful in Trading?
- What Are the Main Types of Trading Channels?
- How Do You Use Trend Channels in Trading?
- How Do You Find Trend Channels on a Chart?
- How Do You Trade Using Trend Channels?
- What Is a Trading Channel Strategy?
- What Are the Advantages and Disadvantages of Trading Channels?
- How Can You Get the Most Out of Trading Channels?
- The Bottom Line
How To Use Trading Channels to Maximize Gains
Channel Indicator Trading can help traders spot trends faster, identify support and resistance, and find better entry and exit points. If you trade regularly, channels can become one of your most practical tools for reading market direction and reacting with more confidence.In this guide, you’ll learn what trading channels are, the main types traders use, how they function, and how to apply them in real trades. By the end, you’ll have a clearer framework for using channels to interpret price action and make smarter trading decisions.
Trading channels plot two parallel lines around price action to highlight support and resistance and define trend structure
Ascending channels identify uptrends, offering buying opportunities near the lower trendline and profit-taking near the upper line
Descending channels mark downtrends, enabling traders to consider short positions near the upper boundary and cover near the lower line
Flat or sideways channels indicate consolidation phases, often preceded by breakouts and useful for range-bound strategies
Envelope-style channels like Bollinger Bands and Donchian Channels dynamically adapt to volatility and signal potential breakouts
Channel-based strategies include trading bounces within the channel and trading breakouts once price exits the established range
Channels support risk management by providing clear stop-loss levels below support or above resistance and profit targets near channel boundaries
Combining channels with other indicators such as RSI, MACD, moving averages, and volume increases signal strength and reduces false signals
What Are Trading Channels?
Many people are visual processors. They do better by seeing a picture as opposed to reading from text about what is happening in a situation. Trading channels help these types of traders (as well as non-visual traders) to develop a visual framework to map out price trends over time. When you look at trading charts that have a trend line that plots against the highest and lowest points of the price of an asset, that’s essentially your trading channel.
As a trader who has been active for any length of time, you will be familiar with the two parallel lines between which “candlesticks” can be found. This is where the price meets its “ceiling,” or resistance level, and the “floor,” or support level. When a price moves within this range, it forms a pattern that you can use to predict the next move the market will likely make.
If you want to read a lot more about candlesticks, read our detailed article here.
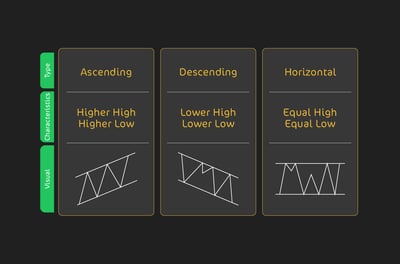
A channel tells you whether your asset is in the middle of an uptrend, downtrend, or just moving sideways within a stable range. For example, in an ascending channel, the price is generally moving up, as you would expect, making it a clear signal for bullish (optimistic) opportunities.
On the other hand, a descending channel shows the price is trending down, which is a bearish (pessimistic) signal that often is a signal to consider shorting positions. In a flat or sideways channel, prices tend to move within a tight range, which can hint at periods of consolidation before a potential breakout.
What is a breakout? Well, it’s when the price moves decisively outside the channel. These are major turning points for any financial asset and are also opportunities for traders to make good profits.
The following image shows the major traits of trend channels.
But what if the signals are highly volatile, and over a period, there are many small ups and downs? These are the cases where trading channels work best because the channel lines show price action more reliably than the candlesticks’ ups and downs alone.
Once you learn to use them, trading channels make decisions easier by giving you a structure to follow in uptrends, downtrends, or sideways breakouts. When you understand how these channels are created and how to use them, you will be ready to take on a more strategic aspect to your trades.
The best thing is that you can use channels for any type of trading, such as stocks, FOREX, commodities, and cryptocurrencies.
Why Are Trading Channels Useful in Trading?
By outlining support and resistance levels, channels give you a clearer picture of when to enter a trade and when to think about closing it. Further, channels don’t just show trends. They show patterns within those trends, helping you see the boundaries within which prices tend to stick. This knowledge can be a game-changer, giving you an edge by structuring trade decisions.
Let's break down how these channels work and why they’re so essential for smart trading.
How do trading channels work?
Trading channels are built by drawing two parallel lines that follow the trend. The top line marks where the price typically hits a ceiling and struggles to go higher. On the flip side, the bottom line shows where the price usually finds a floor, stopping its downward movement. As I have said, these are called the resistance and support levels, respectively.
Between these two lines lies the channel's range, where most of the price action occurs. This setup makes it easy to see potential buying opportunities at the support level and selling chances at the resistance level. Essentially, a trading channel shows where prices tend to fluctuate and helps you trade more confidently within those boundaries.
Why is it important to know trading channels?
Understanding trading channels helps you spot trends and make informed trading decisions. They take out some of the guesswork. For example, buying at the bottom and selling at the top, which is what every trader wants to do and is harder to achieve than it sounds, can be more reliably done with channels.
Stay in Control of Your Investments
Build and manage your own portfolio with ease.
Track profits, dividends, gainers, and losers in real time.
Create a custom watchlist for the assets you care about most.
Get live updates on stocks, ETFs, cryptos, and commodities.
Access everything anytime through a sleek, flexible dashboard.
.webp)
What Are the Main Types of Trading Channels?
Trading channels generally fall into a few main types, each based on how price moves over time. These categories help traders identify whether the market is rising, falling, or moving sideways. Understanding each channel type makes it easier to choose the right trading approach.
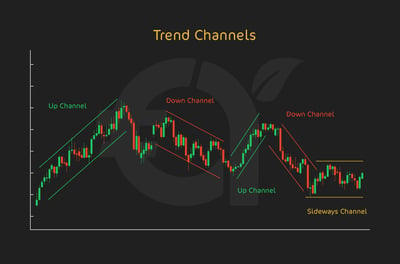
Trend channels
Trend channels give you a structured way to locate and follow the overall direction of the price of an asset. They show you where prices tend to move, making it easier to locate potential entry and exit points based on the overall trend. Let’s talk about the three main types of trend channels:
Ascending channel:
As the name implies, prices are steadily climbing with this channel. The channel is defined by two parallel lines sloping upward—each connecting higher highs and higher lows. This setup promises a bullish trend, meaning buyers are pushing the price up over time. For traders, this channel gives you a chance to buy near the support level and consider taking profits near the top or resistance level. Ascending channels are particularly useful for swing traders and trend traders looking to ride the uptrend.
Descending channel
This forms when prices are mainly going downward within two parallel, downward-sloping lines. Here, lower highs and lower lows are the norm, signaling bearish conditions. This type of channel is perfect for traders looking to short the asset by selling near the upper price and buying back near the lower price.
Flat channel
A flat channel (or sideways or horizontal channel) shows that prices are moving within a fixed range, bouncing back and forth between consistent support and resistance levels. There’s no clear uptrend or downtrend, just a steady sideways movement.
Each trend channel gives traders a unique advantage, allowing them to adapt their strategies to fit the market condition, be it an upward trend, a downward slide, or a steady range.
Envelope channels
With envelope channels, you can assess market volatility by setting up a “band” around the price action. By doing this, you can be better placed to decide how to proceed with your trades. There are two main forms of envelope channels that a lot of traders use: Bollinger Bands and Donchian Channels.
Bollinger Bands
Many traders use Bollinger Bands to track price volatility. You can identify them by looking at the three lines: a moving average in the center, with an upper and lower band set at a certain number of standard deviations away from the moving average. When the price of an asset changes through its volatility, the bands expand and contract.
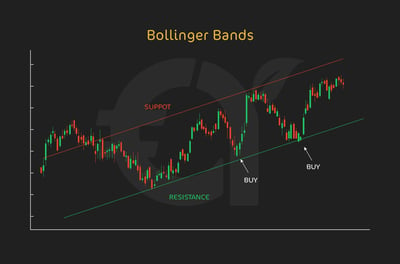
If you have wider bands, then the situation is more volatile, while narrow bands point to a quiet market. When prices hit the upper band, the market might be overbought, whereas touching the lower band can show that the market is oversold. Most traders use Bollinger Bands as a signal to enter or exit trades as they respond to price swings between the bands.
Donchian channels
Donchian Channels are more simple to read than Bollinger Bands, but are possibly more powerful in identifying breakout opportunities. These types of channels show the highest high and lowest low over a period of time, often a set number of days.
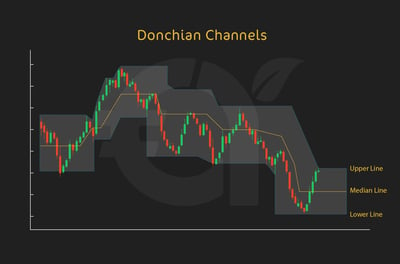
The space between these highs and lows creates the channel. When the price moves above the upper boundary, it may signal a bullish breakout. On the other hand, moving below the lower boundary could possibly mean a bearish breakout. Donchian Channels are most useful for traders who want to capture trend reversals or new trends just as they happen. What’s good about them is that there is a clear boundary for when the price is moving past recent highs or lows.
How Do You Use Trend Channels in Trading?
In my experience, trend channels are highly useful to traders because they give you a structured way to read market direction and timing. As I have said, using them involves spotting price patterns on a chart and drawing two parallel lines—focusing on the highs and lows within a trend.
This visual “channel” shows where the price has mainly oscillated between support and resistance. When trading within these channels, the goal is to capitalize on price movements, where prices often move up and down within the channel lines.
If you keep a close eye on how the price moves within the channel, you can plan entry and exit points with better discretion. In an ascending channel, buying near support lets you ride the trend up, while selling near resistance helps lock in profits.
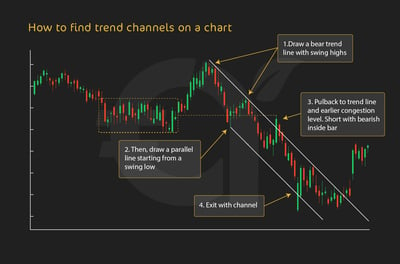
How Do You Find Trend Channels on a Chart?
If you're still unsure about how to read channels, even after reading this article, don’t worry.
Most platforms offer tools to help you draw these lines accurately and typically include many educational resources to show you exactly how things work on their platform.
Finding trend channels on a chart requires a careful eye and plenty of practice.
Look for the pattern: identify a series of higher highs and higher lows for an ascending channel, or lower highs and lower lows for a descending channel.
Draw the upper line: place one parallel line above the highs.
Draw the lower line: place the second parallel line below the lows.
Check the fit: make sure the lines are evenly spaced and follow the trend’s direction without crossing through any major price points.
As I've said, most trading platforms offer built-in tools to help draw these lines accurately. All you need to do is select the channel or trendline tool, put the lines along the key highs and lows, and stretch them out. Some platforms even let you adjust the lines as the trend continues, helping you track the market's real-time movement.
How Do You Trade Using Trend Channels?
Trend channels are traded by buying near the lower boundary and selling near the upper boundary of the channel. This approach aims to capture price movements as they travel between support and resistance. Used carefully, the channel helps traders identify more strategic entry and exit points.
Trading within a trend channel is all about timing your entries and exits to match the movement between support and resistance. When the price approaches support, itis often a buying opportunity, as it’s likely to bounce upward if the trend holds. On the other hand, when the price creeps toward the upper resistance level, you could start thinking about selling, as the price could face downward pressure from this level.
The benefit of trading within channels is that they provide a predictable range in which the price is likely to move. By buying at support and selling at resistance, you can make the most from the regular price oscillations without needing to predict a breakout. This is big, as predicting a breakout is one of the trickiest things to do in trading, and many traders get it wrong, even the experts.
Keep an eye on the trend's momentum and signs of weakening; a breakout may signal a new trend and a shift in strategy.
Using trading channels while you trade
Trading channels go beyond identifying trends by giving you a structured approach to managing trades. Often, we are taken in by our emotional urges to make unplanned trades, but if you have a robust plan that relies on trend channels, you will be less likely to trade on impulse.
Let’s take a look at how trading channels support trading decisions, from setting risk controls to determining trade timing.
Setting stop-loss and take-profit levels
One of the main benefits of trading channels is that they can give you clear zones for setting stop-loss and take-profit levels. This is handy because you might be unsure about where to place your stop-loss and take-profit levels. Set the stop-loss too low, and your funds could bleed out, or set the take-profit too conservatively, and you could miss out on the wins.
When trading within a channel, the support level can serve as a natural stop-loss level, especially in an ascending or flat channel. Putting your stop-loss here minimizes potential losses if the price breaks below support.
The resistance level is an ideal area to place a take-profit order, allowing you to lock in gains as the price approaches the channel's peak. In fast-moving markets, I have found it is often more practical to place the stop-loss slightly beyond support, rather than exactly on it, because brief intraday spikes can trigger exits even when the channel remains intact.
Estimating trade duration
Channels can tell you a lot about how long a trade might last, especially when the price oscillates consistently within the channel boundaries. Look at it this way: if you’ve identified a channel that holds steady over a certain period, you can estimate the time it takes for the price to travel from support to resistance.
This can be important for short-term or swing traders holding positions for a set period. It’s about knowing the typical "life cycle" of a price swing within the channel that can help you decide when to enter and exit without overextending your position.
Determining trade reliability
In my view, not all channels are created equal, and some patterns are more consistent than others. Channels that keep a steady rhythm, with clear, recurring support and resistance levels, are much better for trading.
If a channel formation is consistent, it can be a powerful indicator of trend reliability, giving you more confidence in your trades. A well-defined channel with minimal price breakouts suggests the asset is following a predictable pattern, which can be reassuring when planning your trades.
Buying or shorting the channel
As you’ve probably seen, trend channels give you a straightforward way to decide whether to buy or short an asset within a certain range. When the price reaches the lower boundary of an ascending or flat channel, it’s typically viewed as a buying opportunity, as support may hold and push the price upward.
Then, when the price approaches the upper boundary, it’s telling you to consider selling or shorting, as resistance could trigger a pullback. In a descending channel, shorting near the resistance levels can make the most of downward momentum, while covering or buying near support gives you the upside from the potential for a bounce back up. You will learn over time how trading within these channel boundaries allows you to take advantage of regular price fluctuations without waiting for major market moves.
What Is a Trading Channel Strategy?
A trading channel strategy is all about timing—catching the price at support or resistance for maximum returns.
By waiting for the price to head toward the support level in an uptrend, you are positioning yourself to buy in at a level where the price is likely to bounce up, allowing you to ride the wave to the resistance level. This approach not only takes advantage of the channel's natural flow.
In the same way, when the price approaches the upper boundary, it’s normally a good time to sell or shorten the asset. In a descending channel, you use the same concept in reverse: shorting near resistance as the price trends down and buying back near support!
This clever strategy revolves around reading the channel's movement and timing your trades to make the most of each bounce. With discipline and practice, a trading channel strategy can help you profit from market swings while keeping your trades within a defined range.
What Are the Advantages and Disadvantages of Trading Channels?
Like all trading methods, reading channels has its share of pros and cons. This is why channels might be a flexible tool most of the time, but they can be challenging for traders at times. Here’s a closer look at the main advantages and disadvantages of using trading channels in your strategy.
Advantages
The main advantage lies in the clarity that channels provide for trend identification. By mapping out a clear range for price movement, channels make it easier to spot the direction of the trend, whether it’s moving up, down, or staying flat.
This visual structure provides straightforward entry and exit points: buy near support and sell near resistance. It takes some of the thinking out of trading, but it also reduces emotional trading.
Disadvantages
Surprise, surprise, trading channels are not foolproof. False breakouts are something you will have to get used to, where the price briefly moves outside the channel boundaries only to quickly come back within the range.
You never know what you are dealing with because false signals can create several problems:
Premature entries or exits, disrupting your trading strategy.
Constant adjustment as trends evolve.
Redrawing channel lines when a strong breakout signals a shifting trend and a new price movement.
This frequent monitoring and adjustment can be time-consuming and may make trading channels less effective or enjoyable in highly volatile or rapidly changing markets.
In chart reviews we have carried out during high-volatility sessions, channel breaks that occur without a clear close outside the boundary have tended to fail more often than cleaner breakouts, which is why many traders wait for confirmation before acting.
How Can You Get the Most Out of Trading Channels?
To make the most of trading channels, it’s a good idea to layer in additional techniques to maximize accuracy and minimize risk. Here are a few essential tips for using trading channels effectively:
Use channels with other indicators for confirmation
While channels provide a reliable framework, adding other technical indicators can give you extra confirmation on when to enter or exit. Mixing channels with indicators like the Relative Strength Index or the Moving Average Convergence Divergence can help you confirm whether a price bounce at support or resistance is likely to hold. This added layer of confirmation can make your trades more reliable.
Adjust channels as trends shift
You should know that markets are dynamic, and trends don’t always stay consistent. To keep your channels accurate and relevant, be prepared to redraw your lines when price action clearly establishes new support or resistance. If the price consistently breaks through a channel’s support or resistance, it could signal a new trend, prompting you to redraw your boundaries to reflect the new market direction.
Timing and patience are everything in trading channels
You will need to learn how to wait for the price to reach the support or resistance levels before entering a trade, as this is where you will probably get the most value. Emotional entries can lead to trades outside the ideal range, which can bite you. Practicing patience and being aware of your trading psychology is vital, as it will train you to only act when the price reaches the right strategic point.
The Bottom Line
In my experience, trading channels can be a powerful tool, as they provide a structured framework for monitoring market fluctuations and profiting from them. However, as with any strategy, they come with both wins and pitfalls. The main thing is that channel trading helps you set clear parameters for support and resistance, which, as we’ve seen, are two important pieces of data that can guide your trades.
Channels make it easier to pinpoint entry and exit points, helping you anticipate market moves and improve your trade timing, making your trades more consistent and profitable. That said, you need to be vigilant, as false breakouts can occur, disrupting even the best-laid plans. Overall, if you are a disciplined trader willing to refine your approach, channels can be a powerful asset for making strategic trades within clearly defined boundaries.
FAQ
Trading channels are two parallel lines that mark support and resistance around price action. They help traders spot trend direction, plan entries and exits, and trade with more structure instead of reacting emotionally.
Find a series of swing highs and swing lows, then draw two parallel lines that contain most of the price movement. The upper line marks resistance, while the lower line marks support.
An ascending channel slopes upward and suggests bullish momentum, a descending channel slopes downward and signals bearish pressure, and a flat channel moves sideways between stable support and resistance.
The key to trading within a channel is timing. Buy near the lower boundary (support) in an uptrend and consider selling near the upper boundary (resistance). This approach works in both ascending and descending channels, depending on the market direction.
Envelope channels, like Bollinger Bands and Donchian Channels, use a dynamic range around a moving average to track price volatility. They adjust with market movement, unlike static trend channels, and are especially useful for identifying overbought and oversold conditions.
Channels offer natural reference points for risk management. Many traders place stop-losses just beyond support or resistance and use the opposite side of the channel as a take-profit target.
A major risk is false breakouts, where the price briefly moves outside the channel only to return within it. These breakouts can disrupt trades and lead to unexpected losses, which is why monitoring the channel for consistency is crucial.
Trading channels can be reliable when price movement respects the channel boundaries, but they require regular adjustments to stay relevant to market shifts. Consistent channels are generally more reliable, while volatile markets can lead to more frequent breakouts.
Yes, combining channels with indicators like RSI or MACD provides added confirmation for trades. For instance, if the price nears the channel’s support line while the RSI indicates oversold, this strengthens a buy signal.
With disciplined practice, trading channels help develop a structured approach, thus reducing guesswork. Over time, this strategy can improve timing, enhance profit potential, and build trading confidence by providing a consistent framework.
Traders often look to buy near support and take profits near resistance in rising or sideways channels. In a falling channel, some traders look for short opportunities near the upper boundary.
A breakout happens when price moves clearly above resistance or below support instead of staying inside the channel. It can signal a new trend, but false breakouts are common, so confirmation matters.
Trend channels track price between parallel support and resistance lines. Envelope channels, such as Bollinger Bands or Donchian Channels, adjust with volatility or recent highs and lows, making them useful for breakout analysis.
They can still be useful, but volatility increases the chance of false breaks and frequent redraws. In fast markets, channels work best when combined with confirmation tools and disciplined risk management.
Yes, combining channels with indicators can improve trade confirmation. For example, if price reaches channel support while RSI shows oversold conditions, the setup may carry more weight.
Trading channels can be applied across stocks, forex, commodities, and cryptocurrencies. The core idea is the same in each market: identify support, resistance, and the direction price is most likely to follow.