Table Of Contents
- What are the fundamentals of the MACD indicator?
- How do you read MACD signals?
- What matters most when reading signal strength?
- What are some real-world MACD examples?
- What are the best MACD trading strategies for retail traders?
- Common MACD mistakes retail traders make
- How do you optimize MACD for different markets and timeframes?
- What indicators work best with MACD?
- How should you manage risk when trading with MACD?
- What portfolio considerations matter for MACD-based strategies?
- Conclusion
The Best MACD Strategies for Beginners Using Smarter Trading
The MACD Indicator can help traders spot trend shifts, measure momentum, and avoid weak entries before they turn into costly mistakes. If you have ever bought a breakout only to watch the market reverse, this tool can act as a valuable confirmation signal on your chart.MACD, short for Moving Average Convergence Divergence, is one of the most widely used technical analysis indicators on modern trading platforms. In this guide, I’ll explain what MACD is, how it works, and the best MACD strategy for beginners so you can read signals with more confidence and make better trading decisions.
Moving Average Convergence Divergence (MACD) is a momentum indicator that helps traders spot trend direction, strength, and potential entry or exit points.
Always confirm MACD signals with price action, support/resistance, or volume to avoid false entries.
Use bullish crossovers below the zero line and bearish crossovers above it for stronger trend signals.
Avoid trading MACD signals in sideways or choppy markets where momentum is unreliable.
Adjust MACD settings based on the asset and timeframe to better capture relevant momentum shifts.
Use the histogram to gauge the strength of momentum and spot reversals early.
Combine MACD with other indicators like RSI or moving averages for higher-probability trades.
Practice with one MACD strategy at a time, backtest it thoroughly, and scale up only after gaining confidence.
What are the fundamentals of the MACD indicator?
The MACD indicator helps traders understand momentum and trend direction. It does this by comparing moving averages to show whether price strength is building or fading. For beginners, that makes MACD useful for spotting shifts in market behavior.
When you look at a MACD chart, you will see two trendlines, one at support and one at resistance. Between the two lines, you will see a set of bars jostling up and down. That’s the MACD in action. Each up and down movement tells a story about momentum, reversals, and gives a clue about what you could do next.
In the MACD, the 12-, 26-, and 9-day timelines are most important. These were the timeframes selected by Gerald Appel in the late 1970s as the most common trading cycles at the time, especially the first two, which showed roughly 2 weeks and 1 month.
Even though markets have drastically sped up today with modern platforms facilitating rapid intraday trading, these decades-old sectors still hold up remarkably well across stocks, FOREX, crypto, and indices.
They are highly familiar, and they strike a good balance between speed and reliability. That said, they can be adjusted depending on your strategy (I’ll cover that later).
There are three main MACD components you need to understand:
MACD line. This is simply the difference between the 12-day and 26-day Exponential Moving Averages (EMAs). When the 12-day EMA (which tracks price more quickly) moves above the slower 26-day EMA, the MACD line rises, signaling bullish momentum. When it dips below, it points to growing bearishness. This line is the heartbeat of the MACD.
Signal line. This is the 9-day EMA of the MACD line itself. Think of it as a smoother version of the MACD line, lagging slightly behind. When the MACD line crosses above the signal line, traders see it as a potential buy signal. When it crosses below, it’s a potential sell.
Histogram: shows the difference between the MACD and the signal line. If the histogram bars are growing taller in the positive zone, momentum is strengthening in the bullish direction. If they’re shrinking or flipping into negative territory, then momentum is fading or even reversing. For visual traders, the histogram gives an instant read on market energy.
In our review of multiple liquid charts across stocks, FOREX, and crypto over recent market cycles, the standard 12-26-9 setup was usually the most reliable starting point, although lower timeframes tended to need faster settings to reduce lag.
Stay in Control of Your Investments
Build and manage your own portfolio with ease.
Track profits, dividends, gainers, and losers in real time.
Create a custom watchlist for the assets you care about most.
Get live updates on stocks, ETFs, cryptos, and commodities.
Access everything anytime through a sleek, flexible dashboard.
.webp)
How do you read MACD signals?
You read MACD signals by watching the two lines and the histogram in real time to judge bullish or bearish momentum. When momentum is bullish, price is moving upward, and when it is bearish, price is moving downward. Together, these MACD components help traders interpret market direction more clearly.
Before we get too far in our explanation, a reminder: bullish momentum means that the price is going upward, while bearish momentum means downward.
1. Bullish crossover
A bullish crossover suggests a potential price increase or the start of an uptrend. It mostly happens when a shorter-term indicator crosses above a longer-term indicator, signaling growing momentum or buying pressure. This indicates a bullish period in which buyers controlled the market, pushing prices higher.
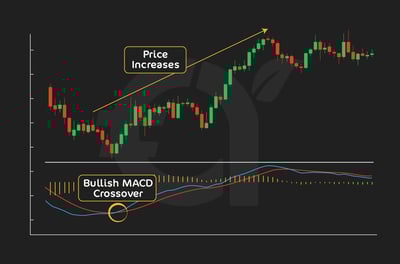
This is one of the clearest signals MACD gives: when the MACD line crosses above the signal line, it suggests bullish momentum is building.
Think of it as the fast-moving average catching up to and overtaking the slower one. Retail traders often use this as a buy signal, especially below the zero line, which suggests the trend is shifting from bearish to bullish.
2. Bearish crossover
On the other hand, when the MACD line crosses below the signal line, it indicates a weakening trend or incoming bearish pressure.
This represents a bearish period where sellers were dominant, driving prices down.
A bearish crossover happens when a shorter-term moving average crosses below a longer-term one. This suggests that recent prices are declining faster than longer-term averages, and it often signals a potential sell opportunity.
This is commonly used as a sell signal, or at least a warning that momentum is fading. If this crossover happens above the zero line, it could be an early sign of a trend reversal or a great time to tighten stops.
3. Zero line crossovers
When the MACD line crosses above the zero line, it means that the short-term EMA has moved above the long-term EMA, which is a classic bullish shift.
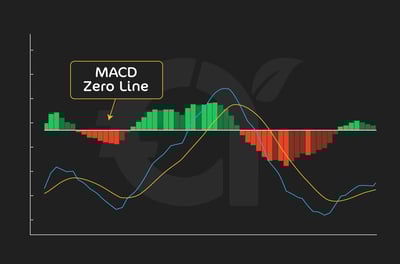
On the other hand, when the MACD falls below zero, it is more bearish. These crossovers develop more slowly than signal line crossovers, but can matter more because they signal a bigger trend change. In fast, news-driven sessions, we often see the histogram weaken one or two candles before a full crossover appears, but in sideways markets that early warning is much less dependable and needs price-action confirmation.
4. Histogram analysis
In my experience, the histogram is useful because it provides a visual representation of the trend's strength. When the histogram bars get bigger (either positive or negative), it means the momentum is increasing.
On the other hand, when the bars shrink, it is a clear sign that momentum is fading, even before a crossover occurs. As you gain experience, you will learn to watch the histogram closely, as it can reveal the start of a reversal.
What matters most when reading signal strength?
When you’ve spotted a crossover, here are some tips to judge if it’s a good idea to trade:
Distance between lines: If you see a wide gap between the MACD and signal line, this is likely a sign of strong momentum. Using this reasoning, when you see a crossover with very little space between the lines, then it could be a weak or short-lived signal.
Histogram momentum: You should be looking at the histogram bars to confirm the crossover. For example, a bullish crossover along with rising positive histogram bars is a stronger signal than a crossover on a flat histogram.
Position relative to the zero line: Crossovers below zero (for bullish trades) or above zero (for bearish ones) often indicate early entries into new trends. Crossovers that happen far from the zero line can signal an overextended trend that’s about to pull back.
What are some real-world MACD examples?
Real-world MACD examples are familiar chart scenarios that show how retail traders might apply the indicator in actual market conditions. These examples make it easier to connect MACD signals with practical decision-making. They also help beginners see how theory translates into real trades.
Example 1: Bullish crossover + entry pointOn a 4-hour EUR/USD chart, the MACD line crosses above the signal line just as the price bounces off a key support level.
The histogram bars start growing. At this point, it would be best to enter right after the crossover confirmation, with a stop just below support. You could time your exit for when the histogram momentum fades or when a bearish crossover appears.
Example 2: Bearish crossover + exit signalOn a daily chart of a stock like Tesla, the MACD line crosses below the signal line after a big rally. The histogram bars would flip from positive to negative.
A trader holding a long position might use this as a sign to scale back from the action or to exit entirely, especially if the price approaches a known resistance level.
Example 3: Zero line bullish crossLet’s say you were looking at a Bitcoin 1-hour chart and you see the MACD line rising and it crosses above zero. The price had likely been consolidating for hours.
Once the histogram flips positive and a bullish crossover happens above the zero line, it would confirm the start of a new uptrend. You should take this as a strong signal to go long.
What are the best MACD trading strategies for retail traders?
MACD is versatile and works across many markets and timeframes. However, as with any good tool, you should always use it with extreme discipline and a clear trading plan.
I’ve put together four practical MACD strategies that you can start using today. Each strategy has different levels of complexity and confirmation strength.
Strategy 1: Basic MACD crossover
This is the easiest win you could get with MACD trading. It’s also where most traders get their first taste of MACD success, mainly because a crossover strategy is simple to execute and gives you clearly defined entry and exit points.
How it works:
Buy Signal: When the MACD line crosses above the signal line.
Sell Signal: When the MACD line crosses below the signal line.
Entry and exit rules:
Enter a long trade when the bullish crossover occurs below the zero line (early in a potential trend).
Exit when the MACD crosses back below the signal line or when histogram momentum fades.
For shorts, reverse the logic.
Risk management:
Always trade with a stop-loss just below recent support (for longs) or above resistance (for shorts).
Target at least a 2:1 reward-to-risk ratio.
Best markets & timeframes:
Swing traders favor the 1-hour, 4-hour, or daily charts.
Works well in trending environments; avoid sideways chop.
This strategy won’t catch every trend, but it’s a great momentum filter and clean signal generator for beginners.
Strategy 2: MACD divergence trading
Divergence occurs when the price and the MACD indicator are telling two different stories. This is a good chance of being a reversal signal, but only if you know how to spot the real thing.
Bullish divergence:
Price makes a lower low, but MACD forms a higher low.
Suggests bearish momentum is fading, even if the price is still falling.
Look to enter a long trade when the MACD line turns up and crosses above the signal line.
Bearish divergence:
Price makes a higher high, but MACD makes a lower high.
Implies weakening bullish momentum. Prepare to go short on a crossover down.
How to spot reliable divergences:
Use clear swing highs and lows; avoid cluttered or noisy charts.
Confirm with other tools: support/resistance, Relative Strength Index (RSI), or volume.
Avoiding false signals:
Never trade divergence alone. If the price is ranging or choppy, MACD divergence becomes much less reliable.
Always wait for confirmation, usually in the form of a crossover or histogram flip.
Divergence trading is best used for catching reversals early, but you have to practice a lot to get it right. Practice spotting clean divergences before using this strategy with real money.
Strategy 3: MACD + support / resistance
This strategy is all about confluence, which is when MACD signals and key price levels go together to improve your chances of success.
You should get in the habit of coming alive when the MACD approaches any support and resistance levels because these are the signals that often carry more weight.
How it works:
Identify strong support/resistance zones on your chart.
Look for MACD crossovers or histogram momentum changes as price approaches those zones.
You should enter only when both price action and MACD agree.
Example:
Price is testing a support level for the third time.
MACD line crosses above the signal line just as the price bounces.
Histogram flips positive, confirming bullish pressure; this is where you enter long.
Exit rules:
Take profit near the next resistance zone.
Exit early if MACD reverses or histogram weakens.
This method helps to cut out the false signals and helps you to stop chasing entries. It’s especially useful in range-bound markets or around breakout zones.
Strategy 4: Multi-timeframe MACD
One of the biggest mistakes new traders make is relying on a single timeframe. We understand why. At the outset, it’s hard enough understanding just one timeframe, let alone two or three.
Using MACD across multiple timeframes can help you filter out noise and focus on the broader trend.
How it works:
Use a higher timeframe (HTF), the 4-hour or daily chart is a great example of this. Use it to identify the primary trend using MACD.
Use a lower timeframe (LTF), such as the 15-minute or 1-hour chart, for precise entries.
Setup example:
On the 4 hour chart, MACD is above the signal line and rising (bullish bias).
On the 1 hour chart, MACD just crossed above the signal line (entry trigger).
What’s happening here is that you are stacking your momentum across timeframes. This increases your confidence and the likelihood of you being successful.
Tips for Execution:
Avoid going against the direction of the higher timeframe, as this is often a losing battle.
Use the HTF MACD for bias, LTF MACD for timing.
This approach takes more screen time and planning, but it helps you trade with the trend rather than against it. This important differentiator is something you will find that distinguishes struggling and successful retail traders.
These MACD strategies give you several ways to approach the market with structure and clarity. You don’t need to use them all at once.
I suggest that you start with one, backtest it, and get comfortable. As you gain experience, layering in things like confluence and multiple timeframes can really lead to better results.
Common MACD mistakes retail traders make
MACD is one of the most popular indicators out there, but sadly, it’s also one of the most misunderstood. It can certainly be a great tool in the right hands, but far too many retail traders fall into common traps that turn good signals into bad trades.
Here are some common mistakes and how you can avoid them:
Mistake 1: Trading every crossover without context
I've seen this one come straight out of the novice handbook. When the MACD line crosses above the signal line, many new traders rush in without a second thought.
But not every crossover is created equal. Without looking at what the price is doing or whether the market is trending, you’re essentially trading blindly.
Real-world slip-up: On a 15-minute chart, a trader sees a bullish crossover in the middle of a sideways market. They enter long, but the price chops back and forth, cutting them out within the hour.
Fix: As I’ve said, you should always pair MACD with price action. Be on the lookout for structure, support, resistance, and trendlines. You should use the crossover as confirmation, not as a standalone trigger.
Mistake 2: Ignoring market conditions
By now, you’ve probably gathered that the MACD works best in trending environments. In volatile, ranging, and choppy markets, MACD tends to produce many false signals.
You should be training yourself to ask: Is this market actually moving in a direction worth trading?
Example: On a daily chart of a stock stuck in a tight range, a trader gets sucked in by back-to-back MACD crossovers. What ends up happening is that you see the trader losing not one but two trades in a row, with no clear trend to ride.
Fix: Use tools like the Average Directional Index (ADX) to confirm trend strength, or just eyeball it. If the price is bouncing between the same levels with no direction, it’s probably best to wait.
Mistake 3: Using default settings without customization
Most platforms default to the MACD 12-26-9. It’s a good place to start, but you don’t have to stay there. Different markets and timeframes may need adjusted settings to better reflect price movement.
Example: A trader uses the default MACD on a 5-minute crypto chart and wonders why the signals are lagging. The lag shouldn’t be a major surprise as those settings were originally meant for longer-term equities.
Fix: For faster timeframes, you could consider shorter EMAs, like 6-19-5. For slower markets, longer settings may help. The point is that you should feel free to test stuff first.
Mistake 4: Misunderstanding divergences
Not all divergences mean that a reversal is on the way. Divergences can easily be misread. Traders spot what appears to be divergence and prepare for a reversal. Remember the rule I spoke about earlier: always look for confirmation!
Example: Bitcoin makes a higher high, while MACD makes a lower high. A trader goes in early and short-sells, expecting a breakdown, only to watch the price surge another 10%.
Fix: Always wait for confirmation. Use a crossover or a histogram flip to back up your divergence read. And remember: in strong trends, divergence can persist without triggering a reversal.
Mistake 5: Poor position sizing based on signal strength
Not every MACD signal deserves the same trade size. Yet many traders go all-in on every crossover, whether it’s strong or weak.
Example: A trader spots a crossover near the zero line, but there’s no momentum in the histogram. Still, they size up, and the trade fizzles.
Fix: Position size according to signal quality. Wide separation between lines, rising histogram, and a solid price setup? That’s worth more risk. Weak crossover with no price support? In an example like this, you should dial it up or skip it.
How do you optimize MACD for different markets and timeframes?
You optimize MACD for different markets and timeframes by adjusting its default settings to fit the way a specific chart behaves. The standard 12, 26, 9 setup is not always ideal for every trading style or asset. Using a more tailored approach can improve entries and help avoid poorly timed exits.
Adjusting for Different Assets
Stocks, FOREX, and crypto don’t all move the same. Stocks will trend more slowly, FOREX pairs often whip back and forth in response to world events, and crypto can surge or collapse in minutes. Each asset type requires its own trading strategy.
Stocks: The default settings often work well for swing trades on daily charts, but may lag on faster moves.
FOREX: Tighter EMAs like 6-19-5 or 8-21-5 help capture quicker momentum shifts on intraday charts.
Crypto: Given its volatility, many traders shorten the EMAs even further, to perhaps 5-15-5, to stay agile.
The goal isn’t to chase signals; it’s to match the sensitivity of the MACD with how your market moves.
One pattern I’ve seen repeatedly when testing intraday setups is that shortening MACD too aggressively can create a burst of attractive signals that look better in hindsight than they perform live, so any setting change should be checked across enough historical trades before you trust it.
Timeframe Considerations
Your MACD settings should reflect how long you plan to hold a trade.
Day trading: Use MACD on 5-minute to 1-hour charts with faster EMAs. Look for quick crossovers and histogram flips to catch intraday swings.
Swing trading: Stick to daily charts and possibly the standard 12-26-9. You want MACD to reflect medium-term trends and filter out noise.
Position trading: Weekly charts paired with longer EMAs (e.g., 19-39-9) help spot bigger trend shifts and keep you from overreacting to small price moves.
Adapting to market conditions
By 'trending,' I mean that a market is moving solidly in a particular direction. If you try to use MACD in a choppy, sideways environment, it’s quite likely that you will come across false signals.
If you’re trading an asset that is trending sideways, or rangebound, as it’s called, consider pairing MACD with other tools like Bollinger Bands or RSI to filter your entries.
Also, remember to adjust expectations: MACD is a momentum tool, not a magic bullet. In flat markets, it might be better to stay on the sidelines or wait for a breakout.
Backtesting is key
Don’t just assume your custom MACD settings will work; test them. If you’ve been reading articles on our website, you will know how often we say that making money from retail trading takes hard work, and backtesting is part of that work.
Use trading platforms that let you replay historical data or simulate trades. You can check the list of some of our best brokers here. Track how your MACD signals perform on the asset and timeframe you want to trade. Note win rates, drawdowns, and how often false signals happen, and how easy it is to fall for them.
A few MACD setting tweaks can make a big difference in trading. Optimizing this indicator to suit your market and style is what separates casual chart readers from traders with an edge.
What indicators work best with MACD?
The indicators that work best with MACD are those that help confirm momentum, identify fakeouts, and add more context to the chart. MACD can be strong on its own, but it is more reliable when used with supporting tools. Combining indicators can improve confirmation before entering a trade.
Let’s look at four powerful combinations that retail traders use every day.
MACD + RSI: momentum confirmation
MACD shows changes in momentum over time. RSI is a very good indicator at telling you whether an asset is overbought or oversold right now.
How it works:
You see a bullish MACD crossover, but RSI is already above 70. That’s a red flag that could mean the price is stretched and due for a pullback.
If MACD crosses bullish and RSI is climbing from a neutral or oversold zone (30–50), the signal is stronger.
Why it works: RSI adds short-term pressure context, while MACD covers trend momentum. Used together, you avoid entering trades at the tail end of a move.
MACD + Volume as a way to validate breakouts
MACD signals that momentum is building, but how would you know if that momentum is backed by real interest? That’s where volume comes in.
How it works:
Look for a bullish MACD crossover on a stock that’s also seeing increased trading volume.
If price breaks resistance, MACD confirms it, and volume spikes, this could well be a valid breakout with real promise behind it.
The key here is in the volume. If there isn’t any, you might be on the wrong track..
Why it works: Volume is one of the best filters on which to base your trades. If MACD says momentum is shifting but the volume is low, it could be a false alarm.
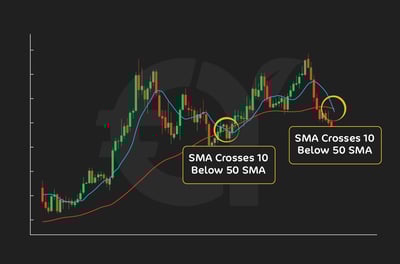
MACD + moving averages that act as trend confirmation
Moving averages define the overall trend. MACD helps you time entries within that trend.
How it works:
Plot the 50-day and 200-day SMAs.
When the price is above both, and MACD gives a bullish crossover, it’s a strong go signal.
When the price is below both, and MACD turns bearish, you’re trading with the trend.
Why it works: This combination helps retail traders avoid trading against the trend, a cardinal mistake. So, in this way, moving averages give structure, while MACD gives timing.
MACD + Bollinger bands give the volatility some context
Bollinger Bands show you how stretched a market is. MACD tells you whether that stretch has momentum behind it.
How it works:
If price breaks above the upper Bollinger Band and MACD gives a bullish signal, then there may be something real behind the breakout.
But if MACD is flat or weakening, it could just be a volatility spike, not a sustainable trend.
Why it works: Bollinger Bands are best at telling you about range, less so direction. The MACD provides the crucial directional information you need.
How should you manage risk when trading with MACD?
From what I've experienced as a longtime trader, even the best MACD setup won’t save your account if you freewheel through your trades and ignore everything you’ve learned about risk management. MACD helps spot momentum and trends, but it doesn’t guarantee success.
What separates consistent traders from frustrated ones is more than reading MACD right. It’s about knowing how much to risk, where to cut losses, and what size trades you should make based on signal strength. Here are some extra tips to improve your chances of success when trading.
Create better position sizes based on signal quality
By now, you know that position sizing should reflect signal quality, with stronger MACD setups deserving more risk than weak, unconfirmed ones. A clear crossover with a rising histogram and price that is obviously bouncing off support is stronger than a random blip in a flat market. So why would you risk the same amount on both?
If the MACD signal is strong (confirmed by trend direction, volume, or support/resistance), you might allocate more capital, let’s say, 2% of your trading account. If the setup is less convincing, dial it back to 0.5–1% or don’t execute the trade at all.
Stop-Loss placement strategies
Think of the stop-loss as your insurance policy. MACD can help you decide when to enter, but where to place your stop depends on price action.
For a bullish MACD crossover, place your stop just below the most recent swing low or support level.
For bearish trades, stop just above the last swing high or resistance.
Avoid setting stops too close to the entry because MACD trades can take time to develop.
This way, you give the trade enough breathing room without exposing yourself to unnecessary loss.
Risk-Reward ratios for different MACD setups
As a rule of thumb, a good MACD trade should aim for a 2:1 reward-to-risk ratio or better. If your stop-loss is 50 pips away, look for a win of at least 100 pips to be extra sure. Here’s a rough guide:
Basic crossover trades: Aim for 2:1 or higher, as these can catch decent trends.
Divergence setups: Riskier, so 3:1 reward-to-risk is better.
Multi-timeframe confirmation: Often more reliable, 2:1 is acceptable if the trend supports it.
Never enter a trade where the potential reward doesn’t justify the risk, even if the MACD looks tempting.
Managing losing streaks when MACD fails
Every trader loses money trading. Losses are just part of the game. In sideways markets, MACD can often lead to false signals and losses. That’s normal. What matters is how you manage it.
Reduce position size after two or three losses.
Reassess the market conditions: is it choppy, low volume, or news-driven?
Step back, review your trades, and wait for cleaner setups.
Just don’t fall into the trap of chasing losses when they are too far gone.
What portfolio considerations matter for MACD-based strategies?
The main portfolio considerations for MACD-based strategies involve avoiding highly correlated trades across multiple assets. When several positions are likely to move together, one failed signal can damage the portfolio more than expected. Managing correlation helps reduce the risk of taking the same trade in different forms.
While it’s perfectly possible that highly correlated assets succeed together, they are just as likely to fail together. You will gladly accept three wins together, but can your capital withstand three losses together?
Spread your exposure across different instruments, sectors, or timeframes. MACD is powerful, but your portfolio should be balanced, not over-leveraged on similar trades.
MACD for Different Trading Styles
One of the great things about MACD is that it’s flexible. Whether you’re glued to the screen all day or prefer letting trades run for weeks, MACD can fit your style. But how you use it and how you set it up should match your time horizon and your trading psychology.
Scalping within ultra-short timeframes
Scalpers are happy to trade in 1-minute to 5-minute charts. For scalpers, it should be obvious that the default MACD settings (12-26-9) are too slow. Traders often switch to tighter parameters like 5-15-5 to get quicker signals.
MACD helps scalpers confirm momentum behind tiny breakouts or reversals. But be warned: it lags slightly, so fast execution and quick exits are key. If you thrive on adrenaline and fast decisions, scalping with MACD might suit you.
Day trading and intraday momentum
Day traders typically use 5-minute to 1-hour charts. MACD here helps confirm short-term trends and intraday reversals. Pair it with volume and price levels for confirmation.
Look for MACD crossovers at key support/resistance levels. Also, histogram momentum can give early clues before the price moves. This is perfect for day traders who want action but still appreciate structure and planning.
Swing trading using multi-day setups
Swing traders use 4-hour to daily charts. This is where default MACD settings (12-26-9) really shine for swing traders. You can spot trend reversals, ride momentum, and let trades play out over several days.
Combine MACD signals with moving averages and price patterns for stronger confirmation. If you prefer fewer but more calculated trades, this style works well.
Position trading through long-term trend following
Position traders think in weeks or months. Weekly charts with longer MACD settings (e.g., 19-39-9) help identify major trend shifts.
MACD here acts as a trend confirmation tool. You’ll enter less often, but you will also aim to stay in longer. This setting is perfect for patient traders who want to minimize noise and focus on the big picture.
Conclusion
The MACD Indicator is a practical tool for understanding momentum, identifying trend direction, and spotting possible buy and sell signals through crossovers, the signal line, and the histogram. For beginners, the real value of MACD is not using it in isolation, but combining it with price action, support and resistance, and sound risk management.If you want to use the best MACD strategy for beginners, start simple, test it consistently, and focus on confirmation rather than prediction. The more you practice reading MACD in real market conditions, the more confident and disciplined your trading decisions can become.
FAQ
MACD, or Moving Average Convergence Divergence, is a momentum and trend-following indicator that helps retail traders spot changes in price direction. It gives buy-and-sell signals based on the interaction of two EMAs and a signal line, helping you avoid late entries and false breakouts.
A buy signal occurs when the MACD line crosses above the signal line, especially if it happens below the zero line. A sell signal occurs when the MACD line crosses below the signal line, particularly above the zero line. Confirm with histogram momentum and price action to reduce false signals.
A crossover refers to the MACD line crossing the signal line and often gives early trend signals. A zero-line crossover occurs when the MACD line moves above or below zero and reflects a more significant trend shift, though it’s slower to appear.
MACD is best suited to trending markets. In sideways markets, it tends to produce false signals. Use tools like Bollinger Bands or RSI to filter trades when the price is ranging.
Yes. While the default 12-26-9 works well for swing trading, faster settings like 5-15-5 are better for scalping or crypto. Adapt MACD settings to match the speed and behavior of your chosen market.
MACD divergence happens when the indicator and price action move in opposite directions. It can hint at an upcoming reversal, but then only trade it with confirmation from a crossover or histogram shift.
Combine MACD with other tools like RSI, moving averages, volume, or support/resistance zones. Confirming signals across tools increases the quality of your entries and reduces losses from false triggers.
Use stop-losses based on recent swing highs, swing lows, support, or resistance. Risk only a small part of your account on each trade and aim for reward-to-risk ratios of at least 2:1 whenever possible.
MACD is a momentum and trend indicator based on the relationship between two exponential moving averages and a signal line. Beginners use it to spot possible trend shifts, confirm entries, and avoid trading purely on instinct.
Read the MACD by watching three parts: the MACD line, the signal line, and the histogram. Crossovers can hint at buy or sell opportunities, while the histogram shows whether momentum is strengthening or fading.
A buy signal usually appears when the MACD line crosses above the signal line, especially below the zero line. A sell signal appears when it crosses below, particularly above zero, but price action should still confirm the trade.
The simplest beginner strategy is the basic MACD crossover. Look for a bullish crossover in the direction of the broader trend, place a stop below support, and avoid taking signals in choppy, sideways markets.
A MACD crossover happens when the MACD line crosses the signal line and often gives an earlier entry clue. A zero-line crossover happens when MACD moves above or below zero and usually confirms a bigger trend shift later.
The histogram shows the gap between the MACD line and the signal line. Growing bars suggest momentum is building, while shrinking bars often warn that the trend is weakening before a crossover appears.
It can, but results are usually weaker. MACD performs best in trending markets, while sideways conditions often produce false crossovers, so it helps to use filters like support and resistance, RSI, or Bollinger Bands.
MACD divergence happens when price and the indicator move in different directions. It can warn that momentum is weakening, but it does not guarantee a reversal, so wait for confirmation from a crossover or histogram change.
Yes, because market speed matters. The default 12-26-9 often suits swing trading, while faster settings may work better for intraday forex or crypto, but any change should be tested before using real money.
MACD works well with RSI, volume, moving averages, and support and resistance. These tools add context, help confirm momentum, and reduce the chance of taking weak signals on their own.