Table Of Contents
- What are Harmonic Patterns?
- What Do You Need to Know About Harmonic Patterns?
- How Do Harmonic Patterns Work?
- What Is the Role of Fibonacci Numbers in Harmonic Patterns?
- What Are the Top 12 Harmonic Patterns?
- Do Harmonic Patterns Work?
- How Do You Identify and Draw Harmonic Patterns?
- What is The Best Harmonic Pattern to Trade?
- What is The Best Time Frame for Harmonic Trading?
- Conclusion
What are Harmonic Patterns? Top 12 Patterns in Trading
Harmonic patterns give traders a structured, math-based way to spot potential market reversals instead of relying on guesswork. By using Fibonacci ratios and recurring price structures, these formations can help you identify high-probability trade setups with more confidence.In this guide, I’ll explain how harmonic patterns work, why they matter in technical analysis, and break down the top 12 harmonic patterns in trading you should know. If you want your decisions to be guided by logic, structure, and precision rather than luck, this overview will give you a strong starting point.
Harmonic patterns help traders predict price reversals using precise Fibonacci ratios and market symmetry.
Many harmonic patterns are named after the animals the patterns resemble.
Popular patterns like the Gartley, Bat, and Cypher offer structured setups to trade with logic, not guesswork.
You can apply harmonic patterns across all assets like FOREX, stocks, commodities, indices, and cryptocurrencies.
Fibonacci retracement and extension levels are the key to harmonic setups and potential reversal zones.
Symmetrical patterns combined with tools like RSI or candlestick signals improve success rates.
Patterns like the Deep Crab and Alternate Bat target aggressive reversal zones with high-reward potential.
Higher time frames (1 hour, 4 hours, daily) produce clearer, more reliable harmonic setups for disciplined traders.
Harmonic patterns work best as part of a broader strategy. Confirmation and patience are essential for results.
What are Harmonic Patterns?
Harmonic patterns are chart formations that help traders find potential price reversals (a point where the price of an asset changes direction) using market movements and Fibonacci ratios.
Here are some interesting facts:
Harmonic patterns were first popularized by the trader H.M. Gartley in the 1930s
His famous "Gartley 222" pattern laid the groundwork for using Fibonacci ratios to predict price reversals
Later, traders like Scott Carney created patterns like the Bat, Crab, and Shark
As a side note, I’ve written a highly detailed article on Fibonacci indicators, which are mathematical levels informed by the famous Fibonacci sequence, and used by traders to predict where prices might reverse, pull back, or continue.
Harmonics, unlike random patterns or guesswork, are powerful because they find precise price movements based on mathematical relationships.
Most traders would rather use this type of intelligent technical analysis than their gut instinct.
Stay in Control of Your Investments
Build and manage your own portfolio with ease.
Track profits, dividends, gainers, and losers in real time.
Create a custom watchlist for the assets you care about most.
Get live updates on stocks, ETFs, cryptos, and commodities.
Access everything anytime through a sleek, flexible dashboard.
.webp)
What Do You Need to Know About Harmonic Patterns?
You need to know that harmonic patterns use repeating market cycles and Fibonacci ratios to help traders estimate where a price reversal may happen. They provide a structured way to read how price swings relate to one another instead of treating each move as random. This makes it easier to anticipate where a trend may slow down, complete, or change direction.
At the root of the harmonic pattern is the line that traces how prices bounce up and down between support and resistance levels during the normal course of trading.
If a price goes up from a certain point to a new mark, then that’s represented by a line on a graph.
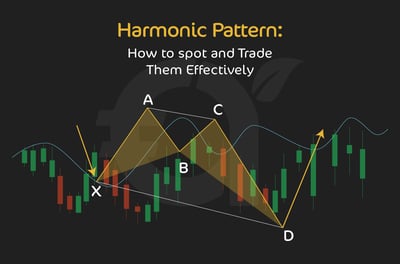
So, when you look at a graph, the first point in a range you are studying is normally called X. When the price moves, the line shoots to A. After the next move, the line moves to B, and so on.
Therefore, harmonic patterns typically follow a sequence of legs, like XA, AB, BC, and CD, forming zig-zags, lightning bolts, or M and W shapes.
In simpler terms, this is what it looks like:
X: The beginning price.
A: The next price point.
B: A retracement of the X-to-A move.
C: A retracement of the A-to-B move.
D: The last price point and entry point.
Those five points form four legs: XA, AB, BC, and CD, which look like this:
How Do Harmonic Patterns Work?
Harmonic patterns work by combining market symmetry with Fibonacci ratios to identify areas where price may reverse. Traders study how each price leg relates to the others and whether those relationships match a known pattern. When the structure and ratios align, the setup can signal a high-probability turning point.
Markets don’t move in straight lines. Price action tends to flow in waves, impulse moves followed by pullbacks, followed by new moves. Harmonic patterns give us a way of representing those waves using specific measurements based on Fibonacci retracements and extensions.
When the price closely follows those measurements, the pattern can signal where the next reversal is likely to occur.
As I’ve said, harmonic setups have four or five key turning points: X, A, B, C, D (sometimes called lines, drives, or legs).
The final point, D, is where you should watch for a reversal.
These patterns have strict rules:
Retracements and extensions need to match specific Fibonacci levels.
The pattern structure must be clean and symmetrical.
Confirmation tools like RSI divergence or candlestick signals improve your odds.
Each harmonic pattern has its own blueprint, but they all aim to help you:
Identify precise entry points.
Define stop-loss and take-profit levels.
Trade with structure, not emotion.
Harmonic patterns can be powerful when used correctly, but they require patience, discipline, and attention to detail. If you get the structure wrong, ignore the Fibonacci ratios, or rush your entry, the pattern is of no use to you.
What Is the Role of Fibonacci Numbers in Harmonic Patterns?
Fibonacci numbers define the measurement framework used to validate harmonic patterns. Traders use key Fibonacci ratios to compare retracements and extensions between price swings. Without those ratios, it is difficult to confirm whether a pattern is complete or worth trading.
Fundamentally, the Fibonacci sequence is a series of numbers where each number is the sum of the two numbers before it, starting from 0 and 1. It goes 0, 1, 1, 2, 3, 5, 8, 13, 21, etc. This sequence forms a ratio called the “golden ratio” (about 1.618), a ratio that can be seen in nature, art, and architecture.
As the numbers progress, the ratio of consecutive numbers gets closer to the golden ratio, which is believed to represent ideal proportions.
In retail trading, whether stocks, commodities, FOREX, or cryptocurrencies, Fibonacci sequences can be used to decide if a pullback in price is non-serious, moderate, or serious.
In trading, Fibonacci retracement levels are best used in technical analysis to work out potential support and resistance levels during price trends. This information could be beneficial to a trader.
So, when trading, if the Fibonacci ratios line up correctly within the pattern’s structure, they help define the potential reversal zone at Point D, where traders can plan entries, stops, and confirmation.
The beauty of harmonic patterns is that they bring discipline to your trading. You’re not guessing price direction; you’re waiting for structure, confirmation, and alignment before acting.
They’re not foolproof, but when combined with proper risk management and other confirmation tools, they offer retail traders a potent edge in spotting reversals.
In harmonic trading, the most common Fibonacci ratios with which you’ll work are:
38.2% and 61.8% retracements for pullbacks
78.6% retracement for deeper reversals
127%, 141.4%, and 161.8% extensions for aggressive price moves
These ratios help traders measure price legs such as XA, AB, BC, and CD and confirm whether the pattern is valid. For example, in a standard Gartley (one of the most common patterns) setup:
AB often retraces around 61.8% of XA
BC and CD legs follow their own Fibonacci rules
Point D is completed near the 78.6% retracement of XA
If the price movements follow along with those levels, the pattern is considered valid, and you can start planning entries, stops, and profit targets with much more confidence.
Always remember that harmonic patterns are stronger in practice when paired with confirmation tools like candlestick signals, moving averages, and Bollinger Bands.
Used together, they help you seriously improve your chances of success.
In the next section, I will introduce you to the most common harmonic patterns.
What Are the Top 12 Harmonic Patterns?
The top 12 harmonic patterns are the key chart patterns traders study to spot potential price reversals using Fibonacci-based structure. Each pattern has its own ratio rules, shape, and trading context. Learning them helps traders compare setups more accurately and apply harmonic analysis with more consistency.
1. The ABCD pattern
Let's start with the ABCD pattern, the foundation for understanding more complex patterns.
The ABCD pattern is one of the clearest reversal structures to learn, because it combines simple chart symmetry with Fibonacci ratios.
What traders get most from this pattern is clarity. It’s a simple pattern that strips away the noise and shines light on measured price moves. You could be trading stocks or crypto, the ABCD shows you where the price could stall or reverse.
Here’s how it worksThe ABCD pattern has four legs:
AB: The initial price move
BC: A retracement of the (first) AB leg
CD: A move resembling AB, promising a potential reversal zone at point D.
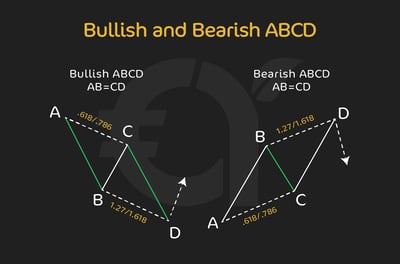
As far as the retracement and extension levels go, these will typically follow these Fibonacci guidelines:
BC retracement lands at 61.8% or 78.6% of AB.
CD leg extends to match AB in length, often aiming for the 127% or 161.8% Fibonacci projection.
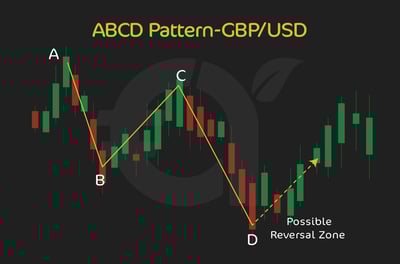
Visually, the ABCD creates a nice, clean zig-zag structure, signalling that the move will most likely become exhausted at point D.
Here’s an example:Let’s see what this looks like in practice. Imagine GBP/USD falls from 1.2800 to 1.2600 (AB), then retraces to 1.2700 (BC). If price symmetry holds, the CD leg extends down to 1.2500, marking the D point as a possible reversal zone.
This pattern is clear to understand because the lines tend to be equal in length, removing the need for interpretation.
How to trade the ABCD patternPoint D is your key reversal area. It’s the point that all the prior clues and information have been leading to from A to B and C to D.
What’s even better is combining what this pattern tells you with supporting clues from other tools, such as RSI divergence or candlesticks.
Key trade guidelines
Take Profit (TP): 38.2% and 61.8% retracement of the CD leg.
Stop Loss (SL): Slightly beyond point D to account for volatility.
Entry zone: Focus near the 127% or 161.8% extension of BC.
Success rate: The ABCD is one of the more dependable harmonic patterns when you read its cues in trending or corrective markets. It works best when price symmetry is clear and supported by other tools.
You need patience and good pattern validation to make this classic harmonic pattern work for you.
2. The Gartley pattern
From my experience as a trader, the Gartley pattern is one of the best-known harmonic patterns in retail trading. It is also known as the “ABCD setup.” Why is it popular? Because it helps traders better see potential price reversals with precise entry and exit points.
Here’s how it works
The Gartley pattern forms when the market follows a clear sequence:
A price move (AB)
A retracement (BC)
Another move (CD), completing the structure
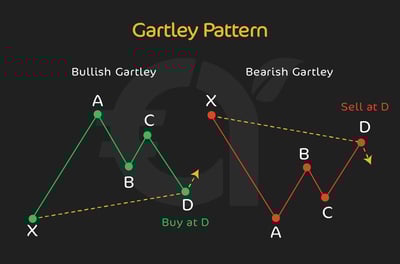
Visually, what you will generally see is a stretched-out lightning bolt or zig-zag formation. Unlike the classic ABCD pattern, the lines in the Gartley are not always of equal length.
Here’s how a typical Gartley pattern looks:
Here’s an example:
Imagine you were trading FOREX and the EUR/USD rallies from 1.0800 to 1.1000 (this is the AB movement.) Then, imagine that the price pulls back to 1.0900 (BC), and then pushes to 1.0950 (CD).
Here’s how this example would look:
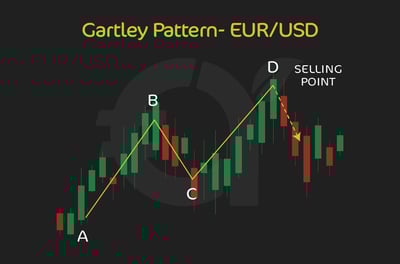
You can see that if the Fibonacci ratios between these points align with harmonic rules, point D becomes a structured trade location for planning risk and confirmation.
How to find an appropriate point D
Point D is the potential reversal zone, and finding it correctly is crucial for this pattern to work in your favor. Most traders use Fibonacci extensions and retracements to make sure they are watching this area.
After the BC retracement, they project the CD leg to match the length of AB, ideally creating a sense of symmetry.
Key trade guidelines
TP: Common targets include the 38.2% and 61.8% Fibonacci retracement levels of the AD leg
SL: Place your stop slightly beyond point D to account for minor price fluctuations.
Entry zone: Many traders combine the 78.6% Fibonacci retracement of the XA leg with the AB=CD completion to identify high-probability reversal zones. When these levels overlap, it creates a strong area to watch for potential trade setups.
Success rate: Typically around 60–70% when the pattern is well-formed and used alongside confirmation tools.
But, be warned! This is not a performance promise. Aggressive market volatility, low liquidity, or ignoring strict pattern validation can reduce effectiveness.
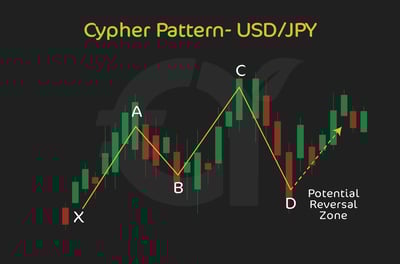
3. The Cypher pattern
The Cypher pattern is a newer addition to harmonic trading. Still, it has quickly gained popularity with retail traders for its unique structure and ability to pinpoint deep reversal zones.
Unlike classic patterns like the Gartley or Bat, the Cypher has its own Fibonacci blueprint, offering setups many traders say can filter out weaker reversals.
Here’s how it worksThe Cypher pattern follows this specific sequence:
XA is your initial price move.
AB retraces between 38.2% and 61.8% of XA.
BC extends beyond XA, typically reaching 127% to 141.4%.
CD then retraces sharply to the 78.6% Fibonacci level of the XC leg.
On the chart, the Cypher looks similar to other harmonic patterns but stretches further before completing, making the reversal zone (Point D) feel more significant.
.webp)
Here’s an example:Let’s say you’re looking at USD/JPY and price rises from 140.00 to 143.00 (XA). Price then retraces to 141.50 (AB), rallies again to 145.50 (BC), exceeding the initial XA leg. Finally, price drops to around 141.00, which lines up with the 78.6% retracement of the XC leg; this is your potential reversal zone at Point D.
If the Fibonacci levels all line up, many traders see this as a high-probability reversal setup.
How to trade the Cypher patternYour key decision zone is Point D near the 78.6% XC retracement. Before entering, many traders wait for additional confirmation, like Japanese candlesticks or trendline reactions.
Key trade guidelines
TP: Aim for the CD leg's 38.2% and 61.8% retracement levels.
SL: Slightly beyond point D to protect against volatility.
Entry zone: The 78.6% retracement of XC is your primary area of interest.
Success rate: Cypher patterns often appeal to traders looking for precision entries with defined risk, but like any setup, results depend on strict validation.
Markets can invalidate the pattern if price action rushes past key Fibonacci levels, so don’t skip the technical checks.
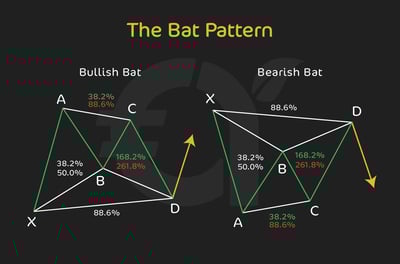
4. The Bat pattern
Another important harmonic indicator is the Bat pattern. It’s popular with retail traders because it helps identify precise turning points before the market fully commits to a reversal.
What sets the Bat apart? It offers a deeper retracement compared to patterns like the Gartley, making it appealing for traders looking to catch reversals with tighter risk management.
Here’s how it worksThe Bat pattern follows a structure based on key Fibonacci levels:
The XA leg is your initial price movement.
The AB leg retraces 38.2% to 50% of XA.
The BC leg extends 38.2% to 88.6% of AB.
The CD leg completes near the 88.6% Fibonacci retracement of the XA leg.
Visually, it’s similar to the Gartley, but the final leg (CD) dips deeper into the previous move, making the setup more conservative.
Here’s an example:Imagine trading GBP/USD, and the price rallies from 1.2500 to 1.2800 (XA). The price then pulls back to 1.2650 (AB), before pushing to 1.2750 (BC). Finally, the price dips to around 1.2520, completing the CD leg near the 88.6% retracement of XA.
If all Fibonacci levels align, your potential reversal zone is at point D.

How to trade the Bat patternThe 88.6% retracement level near point D is your key area to watch for signs of reversal. As we’ve said, the best traders often stack Fibonacci retracements, extension tools, and candlestick confirmation to refine their entries.
Key trade guidelines
TP: Look for the 38.2% or 61.8% retracement of the AD leg.
SL: Place it beyond point D to account for price spikes.
Entry zone: Point D near the 88.6% retracement of XA offers the prime reversal area, mainly when supported by pattern symmetry.
Success rate: When well-formed, Bat patterns can deliver reliable setups, especially when combined with other indicators such as RSI or trendlines.
As always, no pattern guarantees success. Rapid market shifts, unexpected news events, or forcing trades on incomplete setups can reduce your chances. Stick to validation rules.
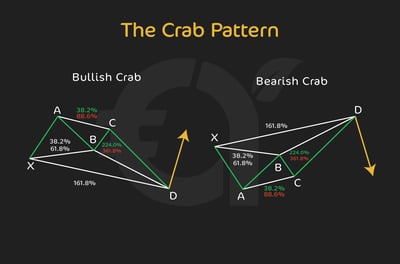
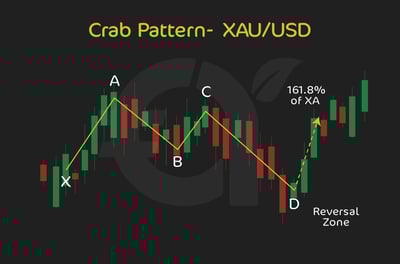
5. The Crab pattern
The Crab pattern is known for producing some of the most extreme price reversals among harmonic setups. Retail traders like this pattern because it targets deep, often aggressive reversal zones with tight stop-loss opportunities. It follows a specific Fibonacci structure that stretches price further than patterns like the Gartley or Bat, but it offers sharp, high-reward setups when it works.
Here’s how it worksThe Crab pattern forms with these key moves:
XA is your first price leg.
AB retraces 38.2% to 61.8% of XA.
BC extends 38.2% to 88.6% of AB.
CD extends sharply, reaching 161.8% of the XA leg.
What makes the Crab stand out is the exaggerated CD leg, which goes beyond the usual structure, creating a deep potential reversal zone.
Here’s an example:Imagine trading Gold (XAU/USD). Price rises from $1900 to $1950 (XA), pulls back to $1925 (AB), then pushes to $1940 (BC). Finally, price spikes to $1965, extending beyond the XA leg, reaching the 161.8% extension.
When the Fibonacci ratios align, traders look for a reversal around point D, often with sharp price reactions.
How to trade the Crab patternThe 161.8% extension of XA is your primary reversal area. All traders are advised to look for a confluence with other tools such as RSI divergences, support/resistance zones, or candlestick confirmation before entering.
Key trade guidelines
TP: 38.2% and 61.8% retracement of the AD leg are typical targets.
SL: Place it slightly beyond point D to account for spikes.
Entry zone: The 161.8% XA extension, reinforced by pattern symmetry and confirmation tools.
Success rate: Well-formed Crab patterns offer high-reward setups, but aggressive market volatility can increase false signals if traders skip validation.
As always, don't trade incomplete setups. Respect the Fibonacci structure to filter out weak patterns and stay disciplined.
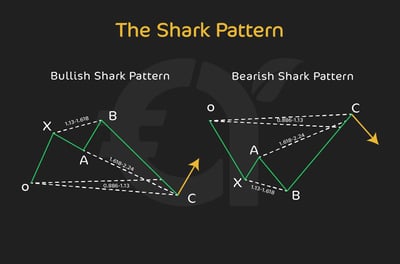
6. The Shark pattern
The Shark pattern isn’t as old-school as the Gartley or Bat, but it’s gained respect among traders for identifying aggressive price spikes followed by sharp reversals. It works well in volatile markets and helps you catch moves before the price fully commits to a new direction.
What makes the Shark unique is that, unlike other harmonic setups, it often forms right before a trend change rather than deep within an existing structure.
Here’s how it worksThe Shark follows this distinct structure:
The XA leg is your initial move.
The AB leg retraces beyond the starting point of XA, typically reaching 113% to 161.8% of XA.
The BC leg extends to 113% or 161.8% of the initial OX leg (O is the starting point of the overall structure).
This pattern often resembles a stretched-out M or W formation, depending on market direction, with exaggerated price extensions.
Here’s an example:Imagine trading USD/CAD, where the price drops from 1.3800 to 1.3600 (XA), then rallies aggressively to 1.3850 (AB), exceeding the initial starting point. The price then retraces to around 1.3650 (BC), aligning with the 113% to 161.8% projection of the OX leg.
When the structure and Fibonacci levels line up, traders focus on point C as the key reversal zone.
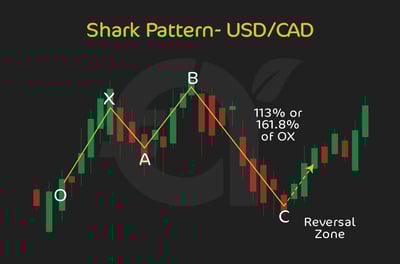
How to trade the Shark patternThe 113% to 161.8% extension levels define your critical reversal area. Many traders combine this with candlestick signals, support zones, or momentum indicators to confirm entries.
Key trade guidelines
TP: Common targets are the BC leg's 50% and 61.8% retracement levels.
SL: Slightly beyond point C to manage risk against volatility.
Entry zone: The reversal zone near 113% to 161.8% of OX, supported by explicit technical confirmation.
Success rate: The Shark works best in volatile environments but requires strict adherence to Fibonacci validation to avoid premature entries.
As with all harmonic patterns, patience is critical. Let the setup fully form and always look for confluence before pulling the trigger.
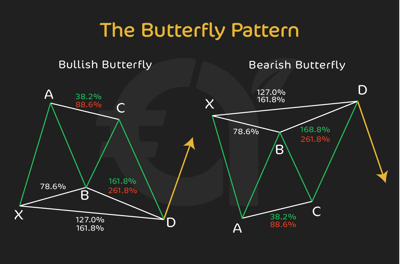
7. The Butterfly pattern
In my opinion, the Butterfly pattern is a classic in the harmonic trading playbook, often used to spot powerful reversal zones right at extreme price levels.
Traders like the Butterfly because it can capture turning points when price extends beyond previous highs or lows, making it ideal for spotting exhaustion points or failed breakouts.
Here’s how it worksThe Butterfly structure looks like this:
XA marks the first price leg.
AB retraces 78.6% of XA.
BC extends between 38.2% and 88.6% of AB.
CD extends all the way to 127% or 161.8% of the XA leg.
Compared to the Gartley or Bat, the Butterfly pattern deliberately pushes price beyond the previous extreme, setting up for sharp reversals at overextended levels.
Here’s an example:You’re trading the EUR/USD. The price climbs from 1.1000 to 1.1300 (XA), then pulls back to 1.1100 (AB), respecting the 78.6% retracement.
Next, the price rallies again to 1.1250 (BC), before stretching aggressively to 1.1350 or beyond, hitting the 127% extension of the XA leg.
When these Fibonacci ratios align, traders consider point D the key reversal zone.
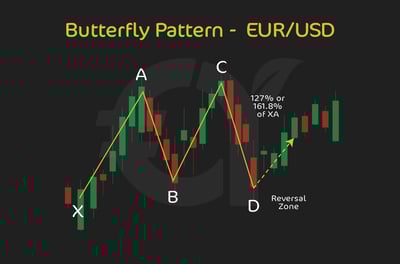
How to trade the Butterfly patternThe 127% to 161.8% extension of XA is your reversal zone. Many traders use candlestick confirmation, overbought/oversold signals, or divergence indicators to time their entries.
Key trade guidelines
TP: Popular targets are the 38.2% and 61.8% retracement of the AD leg.
SL: Placed slightly beyond point D to manage false breakouts.
Entry zone: Focus on the 127% to 161.8% XA extension, reinforced with technical confirmation.
Success rate: Butterfly patterns can offer high-probability reversals when the structure is precise, but incomplete setups or ignoring confirmation can lead to losses.
Markets love to fake out traders at extreme levels; discipline and validation are your best defence.
The next harmonic patterns that I will describe tend to be less commonly found.
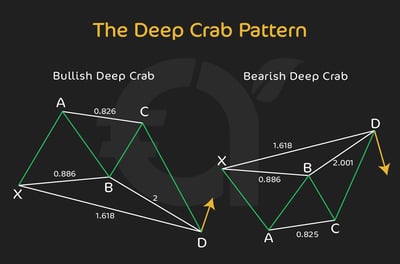
8. The Deep Crab pattern
The Deep Crab pattern is a powerful variation of the standard Crab setup, designed to help traders spot major reversal points at extreme price extensions. This could work for traders looking for sharp, high-reward entries, especially in trending or volatile markets.
What separates the Deep Crab from other harmonic patterns is its deeper AB retracement, which makes the setup more aggressive than the standard Crab.
Here’s how it worksLike all patterns, the Deep Crab follows a structure built around key Fibonacci levels:
XA is the initial price leg.
AB retraces 88.6% of XA, deeper than in many other patterns.
BC extends between 38.2% and 88.6% of AB.
CD pushes out to a 161.8% extension of XA.
The deeper retracement of AB is what gives the Deep Crab its name, creating a structure that signals price exhaustion before sharp reversals.
Here’s an example:Say you’re watching AUD/USD. Price rises from 0.6600 to 0.6800 (XA), then retraces deeply to 0.6620 (AB), almost retesting the starting point. Price then bounces to 0.6700 (BC), before spiking up to around 0.6860, reaching the 161.8% extension of the XA leg.
When the structure aligns, traders target point D for potential reversals.
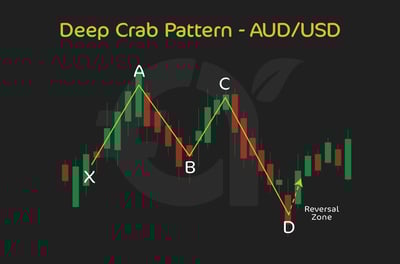
How to trade the Deep Crab patternThe 161.8% XA extension, combined with deep AB retracement, defines the reversal zone. You should pair this with candlestick signals, RSI divergence, or other confirmation tools to fine-tune their entries.
Key trade guidelines
TP: Aim for the 38.2% and 61.8% retracement of the AD leg.
SL: Slightly beyond point D to avoid getting caught in false breakouts.
Entry zone: The 161.8% extension area, especially when backed by the deep AB retracement, marks your prime trade zone.
Success rate: Deep Crab patterns can offer high-reward setups, but as with all harmonic patterns, precision matters. Skipping structural validation or confirmation increases risk.
These patterns often appear near exhaustion points, so discipline and technical checks are your best friends.
9. The Alternate Bat pattern
The Alternate Bat pattern is a modified version of the classic Bat pattern, designed to help traders spot deeper reversal zones with extra confirmation.
What makes this setup stand out is its combination of a shallow AB retracement followed by an aggressive CD leg that completes near the 113% extension of XA, offering high-risk, high-reward opportunities.
traders who use the Alternate Bat appreciate its ability to filter out false signals, especially when price pushes beyond typical retracement levels before reversing.
Here’s how it works
The Alternate Bat follows these Fibonacci-based rules:
XA is your first price move.
AB retraces only 38.2% of XA, shallower than the standard Bat.
BC retraces 38.2% to 88.6% of AB.
CD extends beyond XA, ideally landing near the 113% extension.
This pattern often forms when the market appears to break out, only to reverse sharply after trapping traders at the extremes.
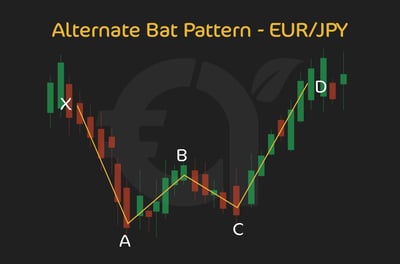
Here’s an example:Let’s say you’re trading EUR/JPY. The price climbs from 160.00 to 163.00 (XA), then pulls back slightly to 161.85 (AB), a shallow 38.2% retracement.
The price rallies to 162.70 (BC), before surging to 163.40, completing the CD leg near the 113% extension of XA.
When these levels align, point D becomes your prime reversal zone.
How to trade the Alternate Bat patternThe 113% XA extension defines the reversal area. Many traders combine this with such confirmation tools as divergence, candlestick patterns, or key support/resistance zones before entering.
Key trade guidelines
TP: Look for the 38.2% and 61.8% retracement levels of the AD leg.
SL: Slightly beyond point D to protect against price spikes.
Entry zone: The 113% extension of XA, supported by other technical confirmations, is your key trade zone.
Success rate: When well-formed, Alternate Bat patterns can offer precise entries, but you should respect the shallow AB retracement and confirm the full structure to avoid premature trades.
This pattern works best when combined with patience and proper validation; rushing in on incomplete setups can undermine its potential.
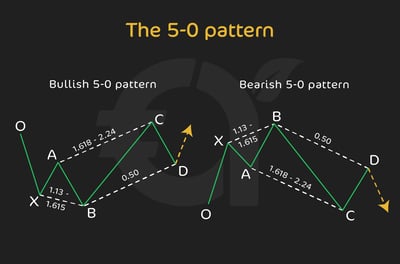
10. The 5-0 pattern
The 5-0 pattern is a lesser-known but highly effective reversal setup in the harmonic world, popular with traders who like spotting early signs of trend exhaustion.
Unlike classic patterns like the Gartley or Bat, the 5-0 often signals a trend change after a sharp move, making it ideal for catching the beginning of new trends rather than just temporary pullbacks.
It’s a structure designed to help traders get in early while maintaining defined risk levels.
Here’s how it worksThe 5-0 pattern follows this formation:
XA is the first price leg, typically sharp and impulsive.
AB retraces 38.2% to 61.8% of XA.
BC extends beyond the start of XA, often reaching 161.8% to 224% of the AB leg.
CD completes with a retracement of 50% of the BC leg—this 50% level gives the pattern its name.
Visually, the pattern looks like a stretched-out zigzag with the final CD leg retracing sharply, offering a clean potential reversal point.
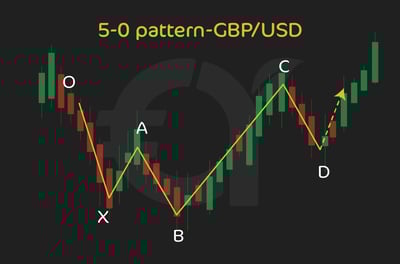
Here’s an example:Imagine trading GBP/USD. The price rallies from 1.2600 to 1.2900 (XA), then retraces to 1.2750 (AB).
The price surges beyond the original high to 1.3000 (BC), then pulls back to around 1.2875, marking the 50% retracement of BC and completing the 5-0 structure.
If the Fibonacci ratios align, traders look at point D for early signs of reversal.
How to trade the 5-0 patternThe 50% BC retracement is your key reversal zone. Many traders add extra confirmation tools like RSI divergence, candlestick formations, or key price levels before committing to the trade.
Key trade guidelines
TP: Typical targets are the 38.2% and 61.8% retracement levels of the CD leg.
SL: Place it slightly beyond point D to manage false breakouts.
Entry zone: The 50% retracement of BC is your primary area to watch, especially when other technical signals align.
Success rate: The 5-0 works best for trend reversal trades, but only when the structure is clean and confirmed. Skipping the technical checks increases risk.
As always, don't chase incomplete setups; discipline and validation keep you on the right side of the market.
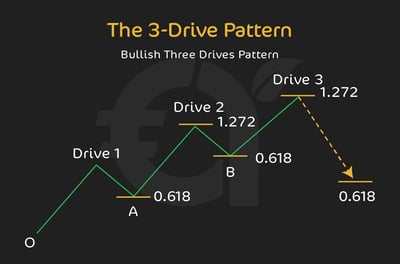
11. The 3-Drive pattern
The 3-Drive pattern is one of the simplest yet most reliable harmonic reversal setups out there. It’s based on the idea that markets often move in sets of three strong pushes before reversing.
Many traders like this pattern because it combines clear price symmetry with Fibonacci ratios, helping to time potential tops and bottoms with better precision.
Unlike some complex harmonic patterns, the 3-Drive structure is pretty straightforward, ideal for spotting trend exhaustion in both bullish and bearish markets.
Here’s how it worksAs the name suggests, the 3-Drive pattern follows three consecutive price movements in the same direction:
Drive 1, followed by a retracement.
Drive 2, followed by another retracement.
Drive 3, marking the potential reversal point.
Each drive and retracement follows Fibonacci guidelines, with:
Retracements often land at 61.8% or 78.6% of the previous drive.
The third drive extends to 127% or 161.8% of the second drive.
What I like about this pattern is that visually, it creates a clear series of three peaks or three troughs, signaling trend exhaustion.
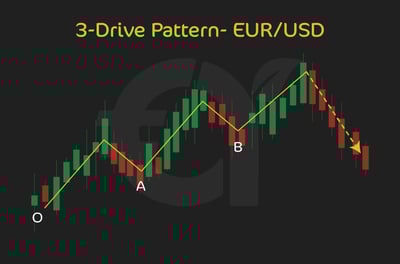
Here’s an example:Imagine trading EUR/USD in a bullish market. Price rallies from 1.0800 to 1.1000 (Drive 1), pulls back to 1.0875, then climbs to 1.1150 (Drive 2), followed by a retracement to 1.1025. Finally, price pushes to 1.1300 (Drive 3), aligning with the 127% extension of Drive 2.
If the structure and Fibonacci levels match, traders focus on the third peak as the reversal zone.
How to trade the 3-Drive patternPoint D, marking the third drive, is your potential reversal area. Many traders add confluence from indicators like RSI divergence, trendlines, or candlestick patterns to fine-tune entries.
Key trade guidelines
TP: Targets often include the 38.2% and 61.8% retracement of the entire 3-Drive structure.
SL: Slightly beyond the third drive to avoid whipsaws.
Entry zone: Focus on the 127% to 161.8% extension of Drive 2 for potential reversals.
Success rate: The 3-Drive pattern works well when price symmetry is clean, but traders must avoid forcing setups on unclear price action.
As with all harmonic patterns, strict validation and patience are essential for this setup to work in your favor.
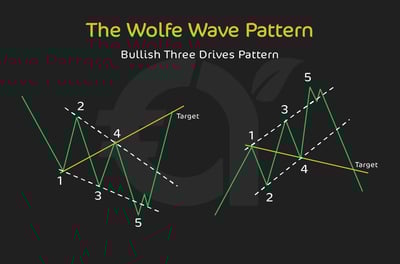
12. The Wolfe Wave pattern
The Wolf Wave is an advanced structure for traders who want to expand beyond traditional harmonics. It isn’t strictly part of the classic harmonic family, but its reliance on price symmetry and projected reversal points makes it a favorite among traders who love structure.
It’s built around five key price swings that help forecast reversals or breakouts with precision, ideal for anticipating major moves before they happen.
Many traders like the Wolfe Wave because it naturally integrates with Fibonacci projections to define targets and entry zones.
Here’s how it worksThe Wolfe Wave forms through five distinct price points:
Points 1 to 4 outline a series of rising or falling swings.
Point 5 completes the formation, marking the expected reversal area.
Once the fifth wave forms, traders draw a trendline from points 1 to 4; this line projects the expected price target after the reversal.
Fibonacci guidelines often enhance this pattern:
The fifth wave frequently lands near the 127% to 161.8% extension of the previous swing.
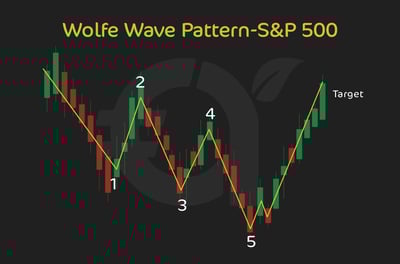
Here’s an example:Say the S&P 500 creates four swings, with price building a rising wedge. At wave 5, price briefly breaks above the structure, aligning with the 127% Fibonacci extension of wave 4.
If confirmed, traders expect a reversal, targeting the trendline drawn from points 1 to 4.
How to trade the Wolfe Wave patternPoint 5 is the reversal trigger. traders watch for additional confirmation, like momentum divergence or candlestick signals, before entering.
Key trade guidelines
TP: The trendline projected from points 1 to 4 acts as the primary price target.
SL: Placed just beyond the high or low of wave 5 to protect against false breaks.
Entry zone: Near the 127% or 161.8% Fibonacci extension of wave 4.
Success rate: Wolfe Waves can offer high-reward setups when the structure is clean, but they require patience, so don’t rush the entry until all five waves are in place.
As with all harmonic-style patterns, discipline and proper confirmation are crucial for consistent results.
Do Harmonic Patterns Work?
The short answer from my experience? Yes, but only under the right conditions and when used with discipline. Harmonic patterns are not magic, but they help you structure your decision-making using clear price symmetry and Fibonacci ratios.
The real advantage of harmonic patterns is that they help you anticipate turning points before they happen, not after the fact.
For example, when you see a Gartley, Bat, or Cypher pattern brewing, and the Fibonacci levels line up, it gives you a clear way forward rather than chasing price unthinkingly.
I can’t say it enough: no pattern works 100% of the time. Market conditions matter. In strong, trending markets or during high-volatility events, even the best harmonic setup can fail.
Harmonic patterns shine in consolidating markets, near key price zones, or when paired with solid technical confirmations. Used correctly, they can offer high-probability setups with clearly defined risk. Used recklessly, they’ll burn your account like any other strategy.
How Do You Identify and Draw Harmonic Patterns?
You identify and draw harmonic patterns by marking price swings and measuring them with Fibonacci ratios to see whether they match a valid structure. The process involves connecting the major turning points in order and checking whether the retracements and extensions fit the pattern rules. With practice, this method helps traders plan entries and reversals more systematically.
Here’s how most retail traders do it:
First, look for obvious price swings, highs and lows that stand out. Most harmonic patterns follow a zig-zag structure: an initial price leg, a retracement, another leg, and a final move that completes the pattern. Think of formations like ABCD, Bat, or Butterfly; they all follow this type of sequence.
Once you spot potential legs, pull out your Fibonacci retracement and extension tools. For example, in a classic Gartley:
You’d measure the XA leg.
Check if the AB retracement lands near 61.8%.
Confirm BC and CD legs align with the required Fibonacci levels.
Each pattern has its own rulebook for what those ratios should be, so this step is non-negotiable. If the levels don’t match, it’s not a valid harmonic setup. This means that it’s a good idea to keep a reference resource (like this article) of all the harmonic patterns you could use.
To draw the pattern, simply connect the swing points: start from X, mark A, B, C, and finally D, the potential reversal zone. Many trading platforms like TradingView offer harmonic pattern tools that help automate the drawing process, but understanding the structure yourself is key.
The more you practice, the better your eye gets at spotting clean setups. Remember, confirmation matters. Don’t jump on every zig-zag you see. Wait for the pattern to fully form and align with the Fibonacci rules.
What is The Best Harmonic Pattern to Trade?
The best harmonic pattern to trade depends on your trading style, current market conditions, and risk tolerance. No single setup works best in every market or for every trader. The right choice is the one that matches your strategy and can be traded consistently with discipline.
That said, some patterns stand out for being more reliable or beginner-friendly:
The Gartley (ABCD) pattern is one of the most popular because of its balanced structure and clear Fibonacci levels. traders like it for spotting reversals with defined risk, especially in trending but slowing markets.
The Bat pattern appeals to cautious traders because it focuses on deep retracements but avoids extreme price extensions, making reversals feel less aggressive.
The Cypher pattern is also a favorite for traders who like precision. It offers high-probability reversal zones, especially when price stretches beyond expectations before turning.
For more aggressive setups, patterns like the Crab or Deep Crab can deliver strong reversals, but they require tighter timing and more experience to trade effectively.
The best harmonic pattern is the one that matches your strategy and market conditions. Newer traders often start with Gartley or Bat setups because they’re easier to spot and manage.
More advanced traders mix in Cypher, Crab, or Butterfly patterns to catch deeper, more explosive reversals.
What is The Best Time Frame for Harmonic Trading?
The best time frame for harmonic trading depends on your trading style, because harmonic setups can work across multiple time frames. Shorter charts may suit active traders, while higher time frames often provide more measured setups. The key is choosing a time frame that matches your pace, patience, and risk approach.
For most retail traders, higher time frames like the 1-hour, 4-hour, or daily charts tend to produce the cleanest, most reliable harmonic patterns. Why? Because:
price swings are clearer,
market noise is reduced, and
Fibonacci levels tend to respect structure better over longer periods.
In other words, fewer fake-outs and more meaningful reversal zones.
If you’re a swing trader or position trader, sticking to the 4-hour or daily chart helps filter out short-term volatility. You’ll spot Gartley, Bat, or Cypher patterns forming over days or weeks, giving you plenty of time to plan your entries with defined risk.
But that doesn’t mean you can’t trade harmonics on lower time frames. Day traders can even look for smaller ABCD or Cypher setups on the 15-minute or 30-minute charts, especially in liquid markets like FOREX. Just remember that lower time frames bring more noise, faster price action, and a higher chance of invalid setups if you rush the process.
Higher time frames = cleaner patterns and more reliable signals, which is ideal for swing trades.
Lower time frames = faster setups and more market noise, which requires quick decision-making and tight validation.
No matter the time frame, the golden rule stays the same: respect the Fibonacci levels, wait for complete pattern formation, and never force a trade that doesn’t tick all the boxes.
Conclusion
Harmonic patterns give traders a clear framework for reading price action through Fibonacci ratios, market structure, and recurring reversal zones. From understanding the basic XA, AB, BC, and CD legs to recognizing advanced formations, the real advantage is being able to approach the market with more precision and less guesswork.The key is not just memorizing patterns, but learning how to validate them patiently and apply them within a broader trading plan. Start by studying one or two setups in depth, test them on charts, and build your confidence over time. Master harmonic patterns, and you’ll make your trading decisions far more disciplined and strategic.
FAQ
Harmonic patterns are chart structures that use Fibonacci retracements and extensions to highlight potential reversal zones. They help traders plan entries, stop-losses, and profit targets with more structure and less guesswork.
Yes, harmonic patterns can be used across FOREX, stocks, indices, commodities, and cryptocurrencies; the rules apply to price action, not the specific asset.
Fibonacci ratios help measure price legs and confirm whether a pattern is valid. They provide structure, reducing emotional decision-making and improving trade precision.
The Gartley pattern is one of the most popular among beginners due to its balanced structure, clear Fibonacci levels, and high-probability reversal zones.
A valid harmonic pattern must respect specific Fibonacci retracement and extension levels, form clean, symmetrical legs, and ideally show confirmation signals like RSI divergence or candlestick patterns.
Yes, but higher time frames like the 1-hour, 4-hour, or daily charts typically produce cleaner, more reliable setups. Lower time frames carry more market noise and false signals.
No trading pattern works 100% of the time. Harmonic patterns increase your chances of spotting reversals, but they must be combined with confirmation tools and strict risk management.
Most traders use Fibonacci retracement and extension tools, available on platforms like TradingView, to measure price legs and map out valid harmonic structures.
Yes, harmonic patterns can be applied to forex, stocks, indices, commodities, and cryptocurrencies. The logic is based on price structure and Fibonacci ratios, so the same principles can work across different markets.
Fibonacci ratios are used to measure each leg of the pattern and confirm whether the structure is valid. When the retracements and extensions align correctly, traders get a clearer potential reversal zone.
A valid harmonic pattern must match its required Fibonacci levels, show clean and reasonably symmetrical legs, and complete at a clear reversal zone. Confirmation from candlesticks or indicators can improve the setup.
Many beginners start with the Gartley or ABCD pattern because the structure is easier to recognize and the Fibonacci rules are clearer. They are useful for learning how harmonic trading works without starting too complex.
No, harmonic patterns are not guaranteed to work every time. They can improve the odds of spotting reversals, but market conditions, confirmation signals, and proper risk management still matter.
Point D is the final part of the pattern and the area where traders expect a possible reversal. It is usually treated as the key decision zone for entries, stop placement, and trade confirmation.
Traders first identify clear swing highs and lows, then use Fibonacci retracement and extension tools to measure the XA, AB, BC, and CD legs. If the ratios match the pattern rules, they connect the points to map the setup.
Higher time frames such as the 1-hour, 4-hour, and daily charts usually produce cleaner harmonic setups. Lower time frames can still work, but they often include more noise and a higher chance of false signals.
Harmonic patterns are often combined with RSI divergence, candlestick signals, moving averages, Bollinger Bands, and support or resistance levels. These extra tools help confirm whether the reversal zone is worth trading.