Space Exploration Technologies Corp. D
D
SPCX
141.550
USD
5.13
(3.76%)
Market Open
Last updated: · Delayed 15 min
Space Exploration Technologies Corp. key facts
- Market capitalization
- 1.92T USD
- EPS
- -0.99
- Volume
- 1,457,068
- Style
- Speculative (losing money)
- Employees
- 22K
- CEO
- Elon Reeve Musk
- Website
- spacex.com
- IPO date
- 12 Jun 2026
- Sector
- Industrials
- Industry
- Aerospace & Defense
Space Exploration Technologies Corp. earnings
Next earnings · Q4 FY2026
EPS estimate
0.40 USD
Revenue estimate
22.69B USD
Last quarter · Q3 FY2026
EPS0.35Beat +161.4%Revenue14.58BBeat +13.3%
Revenue
ReportedEstimate
EPS
ReportedEstimate
| Period | Report date | EPS estimate | Reported EPS | Surprise | EPS growth | Revenue estimate | Reported revenue | Surprise | Revenue growth |
|---|---|---|---|---|---|---|---|---|---|
| Q4 FY2026 | 0.40 | — | — | — | 22.69B | — | — | — | |
| Q3 FY2026 | 0.13 | 0.35 | +161.39% | — | 12.87B | 14.58B | +13.29% | — | |
| Q2 FY2026 | -0.23 | -0.09 | +60.08% | — | 6.83B | 7.81B | +14.46% | — | |
| Q1 FY2026 | — | -1.19 | — | — | — | 4.69B | — | — |
| Period | EPS estimate | Reported EPS | Surprise | EPS growth | Revenue estimate | Reported revenue | Surprise | Revenue growth |
|---|---|---|---|---|---|---|---|---|
| FY2027 | 4.10 | — | — | +2,057.89% | 160.26B | — | — | +235.97% |
| FY2026 | 0.19 | — | — | — | 47.70B | — | — | +147.14% |
| FY2025 | -2.94 | — | — | — | 19.30B | — | — | — |
Space Exploration Technologies Corp. analyst forecast
12-month price target
224.89 USD
+58.88%
Analysts' 1-year price targets range from 75.00 to 450.00, with an average of 224.89.
Past year
1-year forecast
Strong sellStrong buy
Buy
21 ratings
| Strong buy | 0 | |
| Buy | 17 | |
| Hold | 4 | |
| Sell | 0 | |
| Strong sell | 0 |
12-month price target
| Highest target | 450.00 |
| Average target | 224.89 |
| Lowest target | 75.00 |
| Current price | 141.55 |
Space Exploration Technologies Corp. valuation
- Forward P/E (FY2026)
- 745.00
- Price to sales (TTM)
- 59.99
- Price to book
- 10.88
- EV / EBITDA (TTM)
- 135.47
Capital structure
Market capitalization
1.92T USD
+
Total debt
38.84B USD
−
Cash and short-term investments
89.86B USD
=
Enterprise value
1.87T USD
Valuation over time
P/EForward P/EForward P/E · Estimate
Space Exploration Technologies Corp. against its own history
Each figure in the latest fiscal year against the same figure from FY2021 to FY2025: the range, its median (the line) and the latest (the dot, green on the good side of the median). The P/E is today's against its daily readings of five years.
Its peers: GE Aerospace, Caterpillar, RTX, and GE Vernova, the US Industrials companies closest to it in size, each in its own latest fiscal year: their median (the line) and its rank among them, first being the best.
- Gross marginHighest in 5 years49.4%41.2%49.4%Against its peers: 1 of 5Peers' median 26.2%
- Operating marginAt its median-13.9%-33.7%3.3%Against its peers: 5 of 5Peers' median 13.5%
- Net marginAt its median-26.4%-44.6%5.6%Against its peers: 5 of 5Peers' median 13.0%
- Free cash flow marginLowest in 5 years-74.7%-74.7%1.0%Against its peers: 5 of 5Peers' median 10.4%
Peers: US companies of the same industry (of its sector when the industry has too few) from a tenth to ten times its market value, the six closest in size. Updated weekly.
Space Exploration Technologies Corp. growth and profitability
- Revenue (TTM)
- 32.04B USD
- Net income (TTM)
- -2.76B USD
- Gross margin
- 56.74%
- Operating margin
- -2.01%
- Net margin
- -8.61%
Revenue / Net income
Revenue Net income Net margin
Space Exploration Technologies Corp. financial health
- Cash and short-term investments
- 89.86B USD
- Total debt
- 38.84B USD
- Net cash
- 51.01B USD
- Free cash flow (TTM)
- -39.27B USD
- Current ratio
- 3.08
- Debt to equity
- 0.22
- Piotroski score
- 4 / 9
- Altman Z-score
- 14.66
Cash, debt and free cash flow
Cash and short-term investments Total debt Free cash flow
Space Exploration Technologies Corp. ownership
- Institutions
- 94.95%
- Institutional holders
- 1,941 (+1,941)
- Free float
- 2.69%
InstitutionsOthers
As of 30 Jun 2026
Insider trading
| Quarter | Purchases | Sales | Shares acquired | Shares disposed of |
|---|---|---|---|---|
| Q3 2026 | 0 | 5 | 342.17K | 43.47M |
| Q2 2026 | 0 | 1 | 3.57B | 14.28M |
| Q1 2026 | 0 | 0 | 1.04B | 25.17M |
Shares outstanding
Basic shares Diluted shares Change in diluted shares
Source: Financial Modeling Prep

Enjii Ayman
2 hours ago
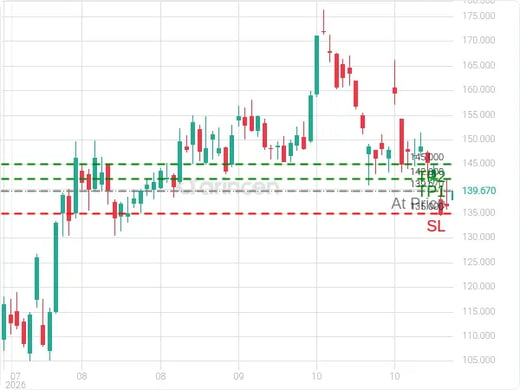

hasan sayed
2 weeks ago
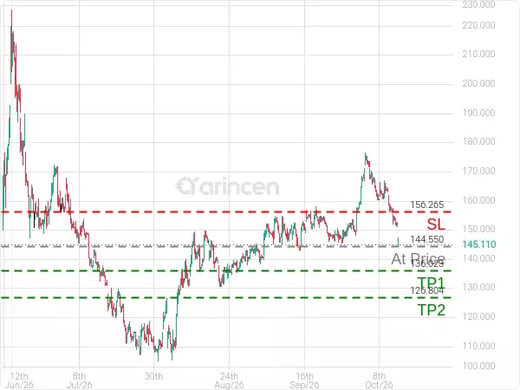

Oussama El Ramadan
4 months ago

Oussama El Ramadan
4 months ago

More







Title: Space Exploration Technologies Corp.
Sector: Industrials
Industry: Aerospace & Defense
Founded in 2002 and commonly known as SpaceX, the Space Exploration Technologies Corporation designs, manufactures, and operates a family of reusable rockets to launch various payloads into Earth orbit for government and commercial customers. Starting in 2019, the company began launching a constellation of its own communication satellites to provide mobile broadband and wireless services under the Starlink brand. In early 2026, the company acquired xAI from its founder, ElonMusk, which operates a large language artificial intelligence model named Grok, a gigawatt-scale data center called Colossus, and the social media network X.