Table Of Contents
- Key Concept
- What Is a Doji Candle?
- Key Characteristics of a Doji
- Types of Doji Candles
- What Does a Doji Candle Tell Traders?
- Doji in Different Market Contexts
- How to Trade the Doji Candle
- Advantages of Using the Doji Candle
- Limitations of the Doji Candle
- Doji vs Other Candlestick Patterns
- Best Indicators to Combine with Doji
- Common Mistakes Traders Make
- Market Psychology Behind the Doji
- When Should You Ignore a Doji?
- Final Thoughts
- Summary
What Is a Doji Candlestick? Types, Meaning, and How to Trade It
Candlestick charts are one of the most widely used tools in technical analysis. They show how price moves over a specific period, highlighting the opening, closing, high, and low levels in an easy-to-understand visual format.
Because of their usefulness, traders rely on candlesticks to understand market behavior and spot trends.
Among the many candlestick patterns, the doji candle is one of the most important signals of market indecision. We’ve written a detailed article on candlesticks that introduces you to many other candlestick types.
In this guide, we’ll focus on the doji candle. You will learn how to identify different types and understand what they tell you about market psychology.
A doji candle forms when the open and close prices are nearly identical, signaling market indecision.
It is easy to identify by its small or non-existent body with upper and/or lower wicks.
A doji does not indicate direction on its own. It’s all about the balance between buyers and sellers.
Its meaning depends heavily on context, especially trend direction and key price levels.
Different types of doji (standard, long-legged, dragonfly, gravestone) show where price was rejected, so read the shape together with the trend and nearby price levels.
Doji candles carry more weight when they appear at support or resistance levels.
You should always wait for confirmation from the next candle before acting.
The doji works best when combined with indicators such as RSI, MACD, or volume.
Key Concept
The big thing you need to understand about the doji candle is that it forms when the opening and closing prices are nearly identical. This most often means there is indecision in the market. It is one of the fastest ways to sense:
Shifts in market sentiment (buyers vs. sellers)
Potential trend exhaustion or continuation
Key turning points around support and resistance levels
In liquid markets, price can change within minutes. Reversal patterns often form after extended trends or periods of high volatility, and candlestick signals like the doji help you read these shifts as they happen, which is why traders use them to time entries and exits.
What Is a Doji Candle?
A doji candle is a type of candlestick pattern where the opening and closing prices are nearly identical. This results in a candle with a very small or almost invisible body.
Visually, it’s not hard to spot a doji. It has a thin central line, with upper and/or lower shadows (also called wicks) extending from it. Here’s what a typical doji looks like:
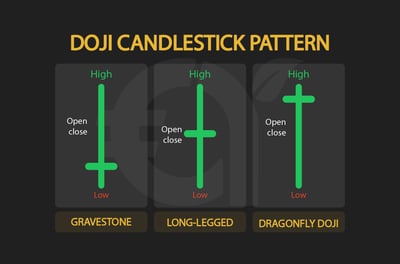
The length of these shadows can vary, but the defining feature remains that the price opens and closes at almost the same level.
This structure reflects market indecision, which is an important factor in trading. During the time period of the candle, buyers may push prices higher, and sellers may push them lower, but neither side gains control by the close.
Because of this, doji candles often appear at important moments in the market:
At the end of a strong trend, signaling a possible reversal
During a pause in price movement, indicating consolidation
For traders, the doji matters because it highlights a potential shift in momentum. While it is not a signal on its own, it can act as an early warning that the current trend is losing strength.
Key Characteristics of a Doji
A doji candle has a few defining features that make it easy to identify and interpret.
Open and Close are close together: Price starts and ends at nearly the same level.
Small or no real body: The body is very thin because there is little difference between open and close.
Shadows can vary: Wicks may be long or short. This reflects how far price moved during the session.
Appears on all timeframes: You can find doji candles on 1-minute, hourly, or daily charts. The concept remains the same.
More meaningful after strong trends: A doji carries more weight when it appears after a clear upward or downward move.
Needs confirmation: A single doji is not enough. Traders wait for the next candle to confirm direction.
A doji is easy to spot, but its value depends on context. The stronger the trend before it, the more important the signal.
Types of Doji Candles
Not all doji candles look the same. Their shape depends on how price moved during the session. Each variation gives slightly different insight into market behavior.
1. Standard Doji (Neutral Doji)
Small or invisible body
Balanced upper and lower wicks
Signals pure indecision
This is the classic form. It shows a balanced struggle between buyers and sellers.
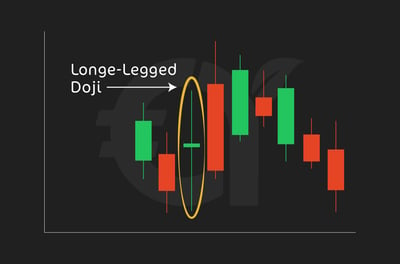
2. Long-Legged Doji
Long upper and lower shadows
Wide price movement during the session
Strong battle between buyers and sellers
This type reflects high volatility. Price moves sharply in both directions but closes near where it opened.
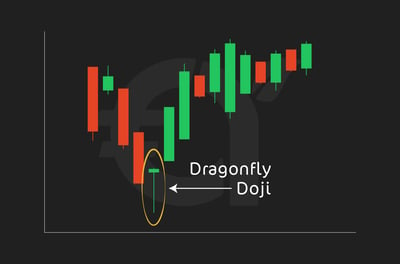
3. Dragonfly Doji
Long lower shadow
Little or no upper shadow
Close near the high
This pattern suggests rejection of lower prices. It often carries a bullish implication, especially near support levels.
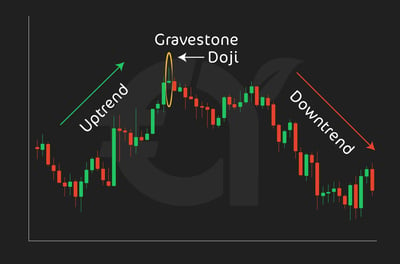
4. Gravestone Doji
Long upper shadow
Little or no lower shadow
Close near the low
This shows rejection of higher prices. It is often seen as a bearish signal, particularly near resistance.
All doji candles signal indecision, but their shape helps you understand where the market rejected price and which side may gain control next.
What Does a Doji Candle Tell Traders?
A doji candle provides insight into market sentiment. It shows what is happening underneath the surface of price action:
Market indecision: Buyers and sellers are evenly matched. Neither side takes control.
Balance of power: The market is pausing. Momentum is no longer one-sided.
Possible trend exhaustion: After a strong move, a doji can signal that the trend is losing strength.
Reversal or continuation: The outcome depends on context. A doji doesn’t predict direction on its own.
Periods of global policy uncertainty often lead to hesitation in financial markets. This hesitation is reflected in price action through patterns like the doji, where buyers and sellers reach a temporary balance.
As a trader, you should view these moments of indecision as potential opportunities. A doji forming around key levels during uncertain conditions can highlight where momentum is weakening, allowing you to prepare for breakouts or reversals once the market commits to a direction.
Just look at this graph from the Bank for International Settlements that shows how sharply measures of economic and trade policy uncertainty rose between 2007 and early 2025.
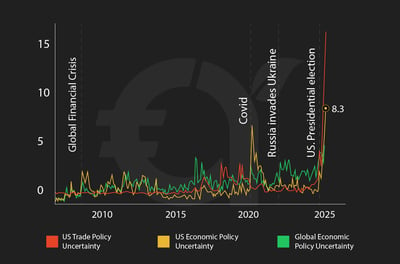
Source: Bank for International Settlements (BIS); data to early 2025.
Location Matters Most
Where the doji appears on the chart is critical.
At resistance: Possible reversal downward
At support: Possible reversal upward
In consolidation (sideways market): Often signals continuation, not reversal
Doji candles are generally more meaningful when they form at key levels rather than in the middle of a trend.
Doji in Different Market Contexts
A doji candle does not have a fixed meaning. Its value depends on where it appears in the trend.
1. In an Uptrend
Signals weakening bullish momentum
Buyers are losing control
Possible reversal or short-term pullback
A doji after a strong rally suggests that upward pressure is fading. Traders watch for bearish confirmation.
2. In a Downtrend
Indicates selling pressure may be slowing
Sellers are losing momentum
Potential bullish reversal
When a doji forms after a decline, it can signal that the market is preparing to turn higher.
3. In Sideways Markets
Often just noise
No clear directional signal
Should not be traded on its own
In ranging markets, doji candles appear frequently. They do not carry strong meaning without support or resistance levels.
It’s important to realize that the same doji can mean different things. Context is everything. Always assess the trend before acting on the signal.
How to Trade the Doji Candle
A doji is not a standalone signal. It becomes useful when combined with confirmation and context.
Step-by-Step Approach
Identify the trend: Determine if the market is in an uptrend, downtrend, or range.
Spot the doji: Look for a clear doji at a key level, not in the middle of noise.
Wait for confirmation: The next candle should show direction.
Bullish close is a potential buy
Bearish close is a potential sell
Use Confluence
Combine the doji with other tools:
Support and resistance levels
Trendlines
Moving averages
These increase the reliability of the signal.
Entry Strategy
Enter on the break of the doji’s high or low
This confirms which side is taking control
Stop-Loss Placement
Place stop-loss beyond the wick extremes
This protects against false breakouts
Risk Management
Do not risk more than a small percentage per trade
Avoid trading every doji you see
Focus on high-quality setups at key levels
Trading tip: A doji without confirmation is just indecision. Wait for the market to choose a direction before entering.
Key takeaway: The edge comes from confirmation and context, not the doji itself.
Advantages of Using the Doji Candle
The doji candle is widely used because it is simple, flexible, and effective when applied correctly.
Easy to identify: The structure is clear. Traders can spot it quickly on any chart.
Works across all markets: Doji candles appear in forex, stocks, crypto, and commodities. The concept remains the same.
Highlights potential turning points: It often appears when momentum is weakening, giving early warning of a shift.
Improves timing: Helps traders refine entries and exits, especially around key levels.
Combines well with other tools: Becomes more powerful when used with:
Support and resistance
Indicators like RSI or MACD
Trend analysis
When analyzing trading setups, the doji becomes far more effective when it aligns with strong support or resistance levels.
Limitations of the Doji Candle
While the doji is a useful pattern, it’s not a solution to everything. You should understand these before relying on it.
It’s not a standalone signal: This is crucial. A doji does not predict direction by itself. It only shows indecision.
Appears frequently: Doji candles form often, especially on lower timeframes. This can lead to false signals.
Requires confirmation: The next candle is essential. Without confirmation, the setup has low reliability.
Less reliable in choppy markets: In sideways or low-volume conditions, doji candles lose meaning and become noise.
Highly context-dependent: The trend, support/resistance, and market structure matter more than the candle itself.
Trading Tip: Don’t trade every doji you see. Focus only on those that appear at key levels with clear confirmation.
A doji is a signal of hesitation, not direction. Its effectiveness depends on context, confirmation, and discipline.
Doji vs Other Candlestick Patterns
The doji is often confused with similar candlestick patterns. The key difference is that a doji is all about neutrality, not direction.
Doji vs Spinning Top: A spinning top has a small body, but it is still visible. A doji has almost no body at all. Remember that both show indecision, but the doji reflects a more balanced outcome.
Doji vs Hammer: A hammer has a small body and a long lower wick. It appears after a downtrend and has a bullish bias. A doji, on the other hand, has no clear directional signal.
Doji vs Shooting Star: A shooting star has a small body and a long upper wick. It shows up after an uptrend and has a bearish bias. A doji does not imply a reversal unless confirmed.
A doji signals indecision. Other patterns, like hammers or shooting stars, suggest direction. Always treat the doji as neutral until the market confirms the next move.
Best Indicators to Combine with Doji
A doji becomes much more reliable when used with other indicators. You should look at it as if these tools help confirm direction and filter out false signals.
Relative Strength Index (RSI): Helps identify overbought or oversold conditions.
Doji + RSI overbought, which means a possible reversal down
Doji + RSI oversold, which means a possible reversal up
Moving Average Convergence Divergence (MACD): Shows momentum shifts.
A doji near a MACD crossover can signal a change in trend
Volume: Confirms the strength of the signal.
High volume probably shows a stronger potential move
Low volume probably shows a weaker signal
Moving Averages: Help define the trend.
Doji near a key moving average can act as a turning point
Works well in trending markets
Combining a doji with RSI and support/resistance levels gives you more than one reason for a trade, which filters out many weak signals.
The doji is most effective when supported by momentum, volume, and trend indicators.
Common Mistakes Traders Make
A lot of traders misuse the doji by treating it as a complete signal. This often leads to poor decisions.
Trading without confirmation: Entering immediately after a doji is risky. Always wait for the next candle to confirm direction.
Ignoring market context: A doji in the middle of a trend or range has less meaning. Location matters more than the pattern.
Overtrading: Doji candles appear frequently. Trading every setup leads to unnecessary losses and higher costs.
Misidentifying patterns: Some traders confuse doji candles with spinning tops or other small-body candles.
Not using stop-losses: Even strong setups can fail. Without a stop-loss, losses can grow quickly.
Most mistakes come from overconfidence and lack of discipline, not the pattern itself.
Market Psychology Behind the Doji
A doji reflects a moment of balance in the market. It shows what happens when buyers and sellers are evenly matched.
Buyers push price higher
Sellers push price lower
Price closes near where it opened
This creates a stalemate where neither side wins.
What Does It Reveal?
Hesitation: Traders are uncertain about the next move.
Loss of momentum: The current trend is slowing.
Transition phase: Control may be shifting from buyers to sellers, or vice versa.
Why Does It Matter?
When analyzing price action, strong trends rarely continue smoothly after clear indecision. A doji often marks the point where the market pauses before choosing a new direction.
When Should You Ignore a Doji?
Not every doji is worth trading. In many cases, it adds little value and can lead to false signals.
Low-volume markets: Weak participation reduces reliability. Price moves lack conviction.
Sideways consolidation: Doji candles appear frequently in ranging markets. They often reflect noise, not opportunity.
Middle of a trend (no key levels): A doji without support or resistance nearby has limited meaning.
Conflicting indicators: If RSI, MACD, or trend direction contradict the signal, it is best to stay out.
Final Thoughts
The doji candle is a simple but useful tool in technical analysis, and it is easy to spot on any chart.
Just remember that its value depends on context. A doji on its own does not provide direction. You must focus on confirmation and confluence, not isolated patterns. Discipline is key. Avoid trading every doji and instead wait for high-quality setups.
Use the doji as a guide, not a guarantee. Applied with patience and proper analysis, it can help you make more disciplined trading decisions, but no candlestick pattern removes the risk of loss.
Summary
The doji is a simple but powerful signal that highlights moments of hesitation in the market. Used with context, confirmation, and discipline, it can help traders make more informed and timely decisions.
FAQ
What is a doji candle?
A doji candle is a pattern where the opening and closing prices are nearly the same. It signals market indecision.
Is a doji bullish or bearish?
A doji is neutral. It does not indicate direction on its own. The outcome depends on context and confirmation.
How reliable is a doji candle?
It is moderately reliable when combined with such other tools as support/resistance, RSI, or trend analysis.
What timeframe works best for doji candles?
Doji candles work on all timeframes. However, higher timeframes (4-hour, daily) tend to produce more reliable signals.
Can beginners use doji candles?
Yes. They are easy to identify. However, beginners should always use confirmation and avoid trading them in isolation.
Do doji candles always signal reversals?
No. A doji can signal either a reversal or continuation. It depends on where it appears on the chart.
What is the difference between a doji and a spinning top?
A doji has almost no body, while a spinning top has a small but visible body. Both indicate indecision, but the doji shows a more balanced outcome.