CME

CME Group
D

CME

264.64
USD
-0.73
(-0.28%)
Market Closed
Volume
56,815
EPS
11
Div Yield
3.6
P/E
26
Market Cap
95,371,010,835
Signals
هشام منسي
هشام منسي
10 months ago
buy
CME
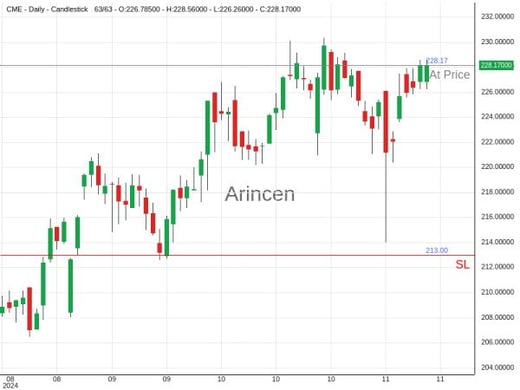
CME @228.17
2024-11-14 06:38
CME@228.17 Chart
Profit
1,823.50
15.98%
More
Related Instruments News

Title: CME Group

Sector: Financial Services
Industry: Financial Data & Stock Exchanges
Based in Chicago, CME Group operates exchanges giving investors, suppliers, and businesses the ability to trade futures and derivatives based on interest rates, equity indexes, foreign currencies, energy, metals, and commodities. The Chicago Mercantile Exchange was founded in 1898 and in 2002 completed its IPO. Since then, CME Group has consolidated parts of the industry by merging with crosstown rival CBOT Holdings in 2007 before acquiring Nymex Holdings in 2008 and NEX in 2018. In addition, the company has a 27% stake in S&P Dow Jones Indices, making the Chicago Mercantile Exchange the exclusive venue to trade and clear S&P futures contracts. Through CME's acquisition of NEX, it also expanded into cash foreign exchange, fixed-income trading, and collateral optimization.

Risk Disclosure: Trading in financial instruments involves high risks including the risk of losing some, or all, of your investment amount, and may not be suitable for all investors. Prices of cryptocurrencies are extremely volatile and may be affected by external factors such as financial, regulatory or political events. Trading on margin increases the financial risks. Never invest money you cannot afford to lose, and carefully assess the suitability of complex products such as CFDs and derivatives in light of your financial situation. Before deciding to trade in financial instrument or cryptocurrencies you should be fully informed of the risks and costs associated with trading the financial markets, carefully consider your investment objectives, level of experience, and risk appetite, and seek professional advice where needed. Arincen would like to remind you that the data contained in this website is not necessarily real-time nor accurate. The data and prices on the website are not necessarily accurate and may differ from the actual price at any given market, meaning prices are indicative and not appropriate for trading purposes.

Arincen and any provider of the data contained in this website will not accept liability for any loss or damage as a result of your trading, or your reliance on the information contained within this website. It is prohibited to use, store, reproduce, display, modify, transmit or distribute the data contained in this website without the explicit prior written permission of Arincen and/or the data provider. All intellectual property rights are reserved by the providers and/or the exchange providing the data contained in this website. Arincen may be compensated by the advertisers that appear on the website, based on your interaction with the advertisements or advertisers.

© 2025 Arincen. All Rights Reserved.