Table Of Contents
- What Is a Financial Report?
- What Is the Importance of Financial Reports for Companies?
- Annual Report vs. 10-K Filing and Quarterly Reports: What’s the Difference?
- Types of Financial Statements
- How to Read Financial Statements: Understanding the Balance Sheet
- How to Read the Income Statement
- How to Read the Cash Flow Statement
- Understanding the Statement of Changes in Shareholders' Equity
- What Do the Numbers in Financial Statements Mean?
- What Are the Limitations of Financial Statements?
- Financial Ratios
- Why Are Financial Ratios So Widely Used?
- Features of Financial Statements
- Tips You Should Know About Financial Statements
- Conclusion
The Ultimate Guide to Using Financial Reports to Invest in Shares
In my assessment, since humans first started trading, record-keeping has been a part of economic activity. These ancient traders found that it made sense to keep a running tally of their inventory, their input costs, and their profits. If you think about it, there’s really no other way to run a business. If you run something as small as even a lemonade stand, it's a good idea to keep records.
Fast forward to today, and that rudimentary record-keeping has morphed into complicated financial reporting. The scale of economic activity may be vastly larger when you are dealing with the financial statements of a modern-day stock market behemoth. Still, at its base, it’s no different from the type of information that ancient farmers who sold sheaves of wheat used. It’s all about assets and liabilities, profitability, and cash flow.
With that in mind, I thought I would use my experience as a long-time retail trader to write this article to help you understand financial reporting. Once you understand it, you can also see how to use it to be a better trader in the stock market. At this point, I should mention that this is not financial advice, merely the benefit of my experience.
What Is a Financial Report?
A financial report, also known as a financial statement, is a formal record of a company’s financial activities over a specific period. These reports provide a snapshot of a company’s financial health, helping investors, analysts, and traders like you evaluate its performance.
As a stock trader, you should know that all companies listed on a stock exchange anywhere in the world are required to publish financial statements regularly, typically on a quarterly and annual basis. These reports are important and, therefore, keenly awaited by anyone interested in understanding a company’s profitability, liquidity, and overall stability.
A typical financial statement includes some key documents, like the
Income statement: which shows the company’s revenues and expenses.
Balance sheet: which outlines the company's assets, liabilities, and shareholders’ equity.
Cash flow statement: which details how cash moves in and out of the business.
Together, these documents offer a comprehensive view of how well the company manages its resources, generates profits, and sustains its operations. For investors like you, understanding these financial reports is crucial to making informed decisions about buying, selling, or holding stock in a company. So, it’s fair to say that understanding financial reports is a big deal.
What Is the Importance of Financial Reports for Companies?
As I’ve said, if a company has its shares listed on a stock exchange, it is, by definition, a public company that is compelled to divulge its financial performance to investors, whether they hold massive amounts of shares in the company or just a few.
Financial reports provide transparency into a company’s financial performance and condition. These reports are a critical communication tool between the company and its stakeholders, including investors, regulators, and creditors, helping to build trust and accountability. Another thing you should know is that for publicly traded companies, releasing regular financial reports is not just a legal requirement but also a way to attract and retain investor confidence.
For management, financial reports serve as a vital tool for internal decision-making. By reviewing key metrics suc as profitability, debt levels, and cash flow, company executives can assess performance against strategic goals, identify areas that need improvement, and make informed decisions on expansion, cost-cutting, or investment.
Annual Report vs. 10-K Filing and Quarterly Reports: What’s the Difference?
Here’s a breakdown of some important types of reporting:
Annual Report: This comprehensive report gives a detailed overview of the company’s operations, financial performance, and future strategies. While it contains financial data, it also includes reflections from the company’s leadership, such as the CEO’s letter, and may highlight accomplishments, market trends, and business plans.
10-K Filing: The 10-K is a more formal and detailed report that U.S. public companies are required to file annually with the Securities and Exchange Commission (SEC). Unlike the annual report, which may be more snazzy and investor-focused, the 10-K focuses primarily on providing a thorough and legally mandated account of the company's financial performance and operations. The 10-K includes audited financial statements, along with a detailed explanation of the company’s business risks, legal proceedings, and executive compensation.
Quarterly Reports: Publicly traded companies in the U.S. must also file quarterly reports (known as 10-Q filings) with the SEC. These reports provide an update on the company's financial performance over the most recent three-month period.
Types of Financial Statements
In my opinion, when analyzing a company's financial health, it's crucial to understand the different types of financial statements available. If you’ve been interested in but not fully invested in company performance, you have likely heard about each of these reports.
Here’s an overview of the four key types of financial statements:
Balance sheet: The balance sheet offers a snapshot of a company's financial position at a specific point in time. It lists a company’s assets, liabilities, and shareholders' equity (how much of the business they own).
Assets represent what the company owns, such as cash, equipment, and inventory, while liabilities show what the company owes, including loans and other debts. Shareholders' equity is basically the owners' claim on the company’s assets after liabilities have been paid off.
Income statement: Also known as the Profit and Loss Statement, the income statement summarizes a company’s revenues, expenses, and profits over a specific period, typically a quarter or a year.
It shows whether the company is making a profit or a loss by deducting expenses (like operational costs and taxes) from total revenues. Key metrics from the income statement include net income, gross profit, and earnings per share (EPS). Investors use the income statement to judge a company’s profitability and operating efficiency over time.
Cash flow statement: The cash flow statement tracks the inflows and outflows of cash within a company over a specific period. It is divided into three sections:
Operating activities: Cash generated or used in the core business operations.
Investing activities: Cash spent on or received from investments, including the purchase or sale of such assets as property or equipment.
Financing activities: Cash from borrowing or repaying debt, issuing shares, or paying dividends.This statement is crucial because it shows how well a company manages its cash to fund operations, pay off debts, and invest in future growth.
Statement of shareholders' equity: Also called the Statement of ownership rights, this financial report outlines the changes in the equity of the company’s shareholders over a reporting period. It details how equity increased or decreased from, for example, issuing new shares, paying dividends, or changes in retained earnings.
If you are new to this, I understand that it’s a lot of detail. If you are committed to becoming the most informed stock trader you can be, then it’s worth investing the time to understand all of this. It will help you with your stock selection strategies and your risk management strategies, too.
Taken together, these financial statements give you a comprehensive view of a company's financial performance, liquidity, profitability, and overall stability.
How to Read Financial Statements: Understanding the Balance Sheet
The balance sheet is one of the most important financial statements. As we’ve said, it offers a snapshot of a company’s financial position at a specific point in time. By understanding how to read the balance sheet, you can gain insight into a company's stability, risk profile, and overall financial health. In this section, I will show you how to make use of the financial information you extract from the financial statements.
Reading the balance sheet statement
The balance sheet is divided into three main sections:
Assets: This section lists everything the company owns, both short-term and long-term. Short-term assets include cash, inventory, and accounts receivable. Long-term assets are things like property and equipment.
Tip: Understanding the asset base can help you assess how well-positioned the company is to meet short-term obligations and generate future growth
Liabilities: Like assets, liabilities are split into short-term (current liabilities) and long-term. Current liabilities, like accounts payable and short-term debt, are obligations the company must settle within a year. Long-term liabilities include loans and bonds that mature in more than a year.
Tip: If you know about a company’s liabilities, you can get an insight into whether the company has too much debt to meet its financial commitments.
Shareholders' equity: This represents the net worth of the company after all liabilities are subtracted from assets.
Tip: A higher equity value relative to debt can indicate a stronger financial position.
Balance sheet analysis using financial ratios
To dive deeper into the financial health of a company, analysts use financial ratios derived from balance sheet figures. Here are a few key ratios to consider:Current Ratio:
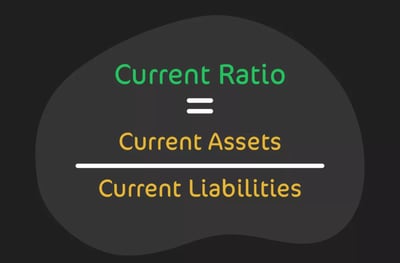
This ratio helps assess a company’s ability to meet short-term obligations with its short-term assets. A current ratio of above 1 indicates that the company has more than enough assets to cover its short-term debts, while a ratio below 1 may signal liquidity issues.
Tip: Always assess the ratio in the context of industry benchmarks, but a good current ratio can fall between 1.5 to 2.0 as it suggests the company has enough assets to meet its obligations without tying up too much capital.Debt-to-Equity Ratio:

This ratio ranks the financial leverage of a company by comparing its total liabilities to shareholders' equity. A higher debt-to-equity ratio means that a company is more reliant on debt to finance its operations, while lower ratios point to more conservative financing.
Tip: Always assess the ratio in the context of industry benchmarks, but, a good debt to equity is somewhere between 1.0 and 1.5 for most companies. Below 1 may indicate that a company uses more equity than debt and above 2 suggests high financial leverage. Remember that financial leverage, in this instance, is different from trading leverage as we know it. It relates to how much companies borrow to finance their operations and not to how much traders borrow to finance their trades.Quick Ratio (Acid-Test Ratio):
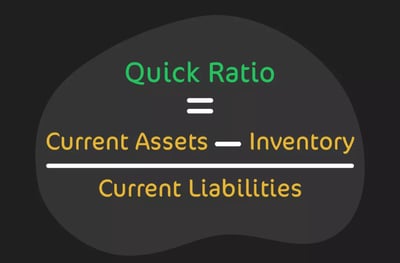
This is a stricter test of liquidity than the current ratio, as it excludes inventory from current assets. It helps assess whether a company can pay off short-term obligations without relying on the sale of inventory.
Tip: A good quick ratio is generally around 1.0 or higher, depending on the industry. It reflects healthy liquidity and financial stability. The company has enough liquid assets to cover its current liabilities without needing to sell inventory. Return on Equity (ROE):
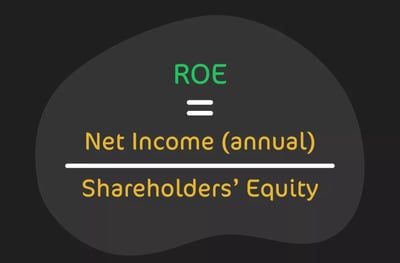
ROE measures how efficiently a company is generating profit from shareholders' investments. A higher ROE indicates that the company is using its equity base effectively to produce income.
Tip: A good ROE generally falls between 15% and 20%, but depends on the industry and the company's business model. ROE measures how efficiently a company generates profit from its shareholders' equity. High-growth industries, such as technology, often aim for ROEs in this range or higher.
How to Read the Income Statement
The income statement, also known as the profit-and-loss statement, provides a detailed summary of a company’s financial performance over a specific period—typically quarterly or annually. It shows how much revenue the company has generated, what expenses it has incurred, and whether it achieved a profit or loss.
Reading the income statement
The income statement is divided into key areas:
Revenue (Sales): This is the money the company earned from selling goods or services during the period. It’s the top line of the income statement.
Cost of goods sold (COGS): This is the direct cost associated with producing the goods or services. Subtracting COGS from revenue gives you the company’s gross profit.
Gross profit: Gross profit is what remains after deducting COGS from revenue. It reflects how well the company is producing or providing its products and services.
Operating expenses: These include all the indirect costs required to run the business, such as salaries, rent, marketing, and administrative expenses. Subtracting operating expenses from gross profit gives you operating income.
Operating income: Also known as operating profit, this figure indicates how much money the company made from its core business.
Net income: This is the company’s total profit after all expenses, including taxes and interest, have been deducted from revenue. It is the most critical figure for understanding the company’s profitability.
Income statement analysis using financial ratios
Analyzing the income statement through financial ratios can give you insights into a company’s performance, profitability, and operational efficiency. Here are some key ratios to consider:Gross Profit Margin:

This ratio shows the percentage of revenue that exceeds the cost of goods sold. A higher gross profit margin shows that the company is controlling its production costs well, leaving more revenue to cover other expenses and generate profits.
Tip: Gross profit margins vary significantly across industries. For manufacturers, 20-30% can be considered strong, whereas retailers may have margins between 10-20%. A declining margin might reveal rising cost of operations, so you should monitor trends over multiple periods.Operating Profit Margin:

This ratio reflects how much profit the company generates from its core business operations. It measures operational efficiency by showing how much of the company's revenue is left after covering such operating costs as salaries, rent, and utilities.
Tip: This margin is concerned with both cost of goods sold and operating expenses. A good operating margin is usually between 15-20% for service-based industries but may be lower for capital-intensive sectors.Net Profit Margin:
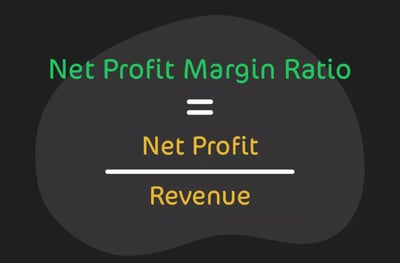
The net profit margin is the percentage of revenue that remains as profit after all expenses, including taxes and interest, have been deducted. A higher net profit margin indicates better overall profitability, meaning the company is retaining more of its earnings after covering all costs.
Tip: A healthy net profit margin is often above 10%, though low-margin businesses, such as grocery chains, might operate profitably with margins as low as 2-5%. Look for consistent net margins over time to make sure a company is managing its expenses well.Earnings Per Share (EPS):
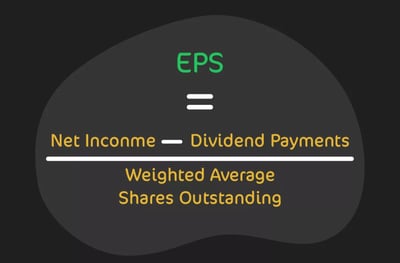
If you’ve heard of any metric, it’s probably EPS. It is a popular metric that indicates how much profit is attributable to each share of the company's common stock. A higher EPS suggests greater profitability per share.
Tip: EPS trends matter more than a single snapshot. A growing EPS surely means profitability improvements, but pay attention to dilution if the company issues new shares. Compare EPS with industry peers for a clearer picture of earnings performance.Return on Sales (ROS):
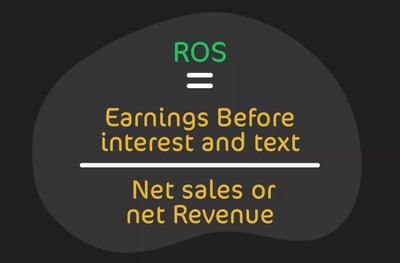
ROS measures how efficiently a company turns revenue into operating profit. It’s particularly useful for comparing companies in the same industry to see which ones are operating more efficiently.
Tip: A good ROS typically ranges from 5-10%, though it varies widely by sector. A consistent ROS indicates efficient operations, but sudden increases must be investigated, as they may be influenced by short-term factors or cost-cutting measures.Return on Equity (ROE):
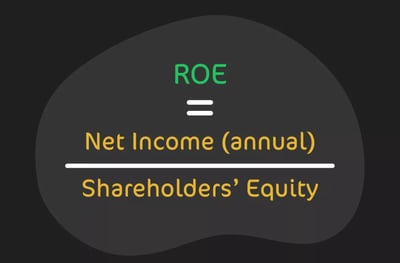
ROE measures the profitability relative to shareholders’ equity. It shows how well the company uses the capital from its shareholders to generate profits. A higher ROE indicates more effective use of equity capital.
Tip: A sustainable ROE is somewhere between 15-20%, depending on the industry. Look deeper if ROE exceeds 25%—it could be due to excessive leverage. Compare ROE against peers and analyze whether growth is driven by debt or operational efficiency.
How to Read the Cash Flow Statement
I know that this article contains a lot of sometimes-technical detail of which a new or intermediate stock trader might question the value. But, stick with us. Next is the cash flow statement. You might ask: Why should I know about cash flow when I invest in gigantic companies dripping in cash?
Well, the cash flow statement offers insights into a company's cash generation and usage over a period. This report is particularly useful for understanding whether a business can sustain operations, manage debt, and fund future growth through its cash inflows, which can be critical when choosing stocks in which to invest.
Many experienced stock investors consider the cash flow statement just as valuable—if not more—than the profit-and-loss statement when evaluating potential stock picks. A positive operating cash flow, coupled with responsible investment and financing activities, often indicates solid financial management. On the other hand, frequent negative cash flows or reliance on financing for operations can signal potential risks.
The cash flow statement is divided into three main sections:
Cash flow from operating activities (CFO): This section shows the cash generated or used in a company’s core business operations, such as cash receipts from sales and cash payments for expenses like salaries, rent, and taxes.
Cash flow from investing activities (CFI): This section reflects the cash spent or earned from investments in assets, such as property, equipment, or securities. Negative cash flow in this section may be a good sign if the company is investing in growth, such as purchasing new equipment.
Cash flow from financing activities (CFF): This section outlines the cash that flows between the company and its investors. It includes activities like issuing or repurchasing stock, taking on or repaying debt, and paying dividends.
Cash flow analysis using financial ratios
Analyzing the cash flow statement with financial ratios gives you insight into the company’s liquidity, efficiency, and ability to sustain its operations. Pay attention to these ratios used in cash flow analysis:Operating cash flow (OCF) ratio:

This ratio assesses a company’s ability to cover its short-term liabilities with the cash generated from its operating activities. A higher OCF ratio suggests that the company has enough cash to meet its current obligations, making it more financially stable.
Tip: A ratio above 1 is considered healthy, as the company can likely pay off its short-term obligations without relying on external financing. However, be sure to compare with industry norms—capital-intensive sectors may have lower OCF ratios due to higher working-capital needs.Free cash flow (FCF):

Once a company has spent money on important items like equipment or property, free cash flow measures how much cash is available. Positive FCF is a much-desired position as it means the company has cash left over to pay dividends, reduce debt, or reinvest in the business.
Tip: Positive free cash flow is a strong indicator of a company’s financial flexibility, Consistent negative FCF might just reveal overexpansion or operational inefficiencies.Cash flow margin:

The cash flow margin shows how efficiently a company converts its revenue into cash. A higher cash flow margin likely means that the company is generating more cash from each dollar of revenue.
Tip: Higher margins mean better liquidity management. Remember to compare it with industry peers since some sectors—like retail—may naturally have lower cash flow margins compared to technology firms with less inventory.Cash flow-to-debt ratio:

This ratio gives an insight into how much of a company’s debt could be covered by its operating cash flow. A higher ratio suggests the company is in a better position to pay down its debt using the cash it generates from its operations, reducing financial risk.
Tip: A ratio above 0.2 is generally considered good. This probably means the company can generate enough cash to manage debt comfortably. Watch for downward trends though, as declining ratios may signal future liquidity problems.Dividend coverage ratio:
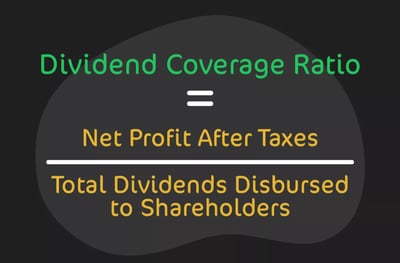
When assessing this ratio, you are trying to figure out a company’s ability to cover dividend payments with its free cash flow. A ratio above 1 indicates that the company generates enough cash to cover its dividends, while a lower ratio may signal that the company is struggling to maintain its dividend payouts.
Tip: A ratio above 1 suggests dividends are well-covered by cash flow. However, if the ratio consistently falls below 1, the company might need to use debt to sustain dividends, which could signal unsustainable payouts.
Understanding the Statement of Changes in Shareholders' Equity
We've come to the final part of the financial reporting package, which is the Statement of Changes in Shareholders' Equity. This report provides a detailed account of how shareholders' equity has changed over a reporting period, typically a quarter or a year. This statement helps investors understand how the value of shareholders' ownership in the company has fluctuated due to various factors such as profits, losses, dividend payments, and stock issuance or buybacks.
Key components of the statement of changes in shareholders' equity
Here is a snapshot of the items you would be watching for when studying a statement of changes in shareholder’s equity:
Beginning equity: This is the equity balance at the start of the reporting period, carried forward from the previous period’s statement.
Net income or loss: The company's net income or net loss for the period is added to (or subtracted from) shareholders' equity.
Dividends paid: If the company pays dividends to shareholders, these payments reduce shareholders' equity.
Stock issuance or repurchase: If the company issues new shares of stock, it increases shareholders' equity. On the other hand, if the company repurchases (buys back) its own shares, it reduces equity.
Retained earnings: This is the portion of the company's net earnings that is not distributed as dividends but isreinvested in the business.
Ending equity: This is the total equity at the end of the reporting period, after all changes have been accounted for.
Why the statement of changes in shareholders' equity matters
The statement of changes in shareholders' equity should be of interest to you because it provides insights into how a company’s activities and performance impact the ownership value of its shareholders. It shows how the company is handling its profits—whether reinvesting them for growth or distributing them to shareholders as dividends.
For companies that issue new shares, the statement highlights how equity dilution affects existing shareholders. On the other hand, for companies repurchasing shares, it shows how the company is using its cash to buy back stock, potentially increasing the value of remaining shares. Overall, understanding this statement helps you assess how shareholder value is being maintained or enhanced over time.
What Do the Numbers in Financial Statements Mean?
As I've shown, the various numbers in financial statements provide key insights into a company's financial health, performance, and potential for growth. Each figure tells a part of the story, from how much the company earns and spends to its ability to pay debts and create value for shareholders. Here’s a recap of what some of the critical numbers represent across the major financial statements:
Balance sheet numbers
Assets: These numbers reflect everything the company owns, including cash, inventory, equipment, and property.
Liabilities: Liabilities are what the company owes, such as loans, accounts payable, and other debts.
Shareholders' equity: This figure shows the net worth of the company after liabilities are subtracted from assets. It represents the ownership value, including retained earnings and capital invested by shareholders.
Income statement numbers
Revenue: Often referred to as the "top line," revenue is the total amount of money the company brings in from sales of goods or services.
Cost of goods sold: This number represents the direct costs of producing the goods or services sold by the company. It includes materials and labor directly tied to production. Revenue minus COGS gives you gross profit.
Net income: This is the company’s total profit after all expenses, taxes, and interest have been deducted from revenue. It is known as the "bottom line."
Earnings per share: EPS is a key indicator of how much profit is attributed to each share of stock. Investors use EPS to gauge the profitability of a company on a per-share basis.
Cash flow statement numbers
Operating cash flow: This number represents the cash generated or used by the company’s core business activities.
Investing cash flow: This shows how much cash is being spent on investments, such as purchasing new equipment, acquiring companies, or selling long-term assets.
Financing cash flow: This reflects cash inflows and outflows from such activities asissuing new stock, repurchasing shares, borrowing, or repaying debt.
What these numbers mean for investors
The numbers in financial statements help you assess a company's performance, risk, and growth potential. For example:
Rising revenue shows that the company is growing.
Expanding margins suggest better cost management.
High cash flow from operations indicates strong day-to-day business performance.
By examining these numbers and the financial ratios they produce, you can make informed decisions about whether to buy, hold, or sell a company’s stock. These figures also help assess the company’s ability to meet debt obligations, pay dividends, and reinvest for future growth.
What Are the Limitations of Financial Statements?
In my experience, it would not be revolutionary to say that everything in life has a downside. While financial statements are essential for evaluating a company's performance and financial health, they do have several limitations of which you need to be aware:
Rely on historical data
Financial statements reflect past performance and do not provide insight into future performance.
Non-Financial factors are ignored
Financial statements focus on quantifiable, monetary aspects of a company's performance. They do not capture non-financial factors such as customer satisfaction, brand strength, innovation capacity, or employee morale, which, we can all agree, impact a company's long-term success.
Different Accounting methods
For example, companies can choose different methods for inventory valuation (FIFO, LIFO, or weighted average), which can affect net income and balance sheet totals. This sometimes makes it difficult to compare financial statements across different companies.
Does not reflect market value
Balance sheets show the book value of assets, liabilities, and equity, but this is not necessarily the same as the market value.
Potential for manipulation
Although companies must follow accounting standards, there are opportunities for management to manipulate financial results within these rules. This has happened all too often. Think of high profile cases like Enron and Worldcom.
Doesn’t reflect cash-flow timing
The income statement records revenues and expenses when they are earned or incurred, rather than when cash is actually received or paid (accrual accounting). This means that a company might show strong revenue growth but still struggle with cash-flow issues.
Comparability across industries
Financial statements may not be directly comparable across industries due to differences in business models, capital structures, and accounting practices.
No real-time information
Financial statements are typically released on a quarterly or annual basis, meaning they don’t provide real-time updates on a company's performance.What Are the Notes in Financial Statements?
The notes to the financial statements, often referred to as footnotes, are an often overlooked but important part of a company's financial reporting. While the main part of the financial statements we’ve already talked about — balance sheet, income statement, cash flow statement, and statement of shareholders' equity — provide the most important details you can’t afford to ignore, the notes are also highly useful as they give you additional detail, context, and explanations that help clarify parts of the business about which you might have questions.
Here’s a closer look at what these notes include and their importance:
Accounting policies
The notes typically begin with a description of the accounting policies the company has used to prepare its financial statements. In case you didn’t know this, there are several types of accounting standards around the world. For example, International Financial Reporting Standards (IFRS) are used in more than 140 countries globally, while Generally Accepted Accounting Principles (GAAP) are used in the United States.
Why you need to know this: This allows you to understand the accounting framework under which the company is operating. It also ensures that the financial statements are interpreted correctly.
Breakdown of financial statement items
The notes often provide detailed breakdowns or extra data for major items on the financial statements such as a breakdown of property, plant, and equipment into land, buildings, and machinery, or a more granular explanation of income taxes, separating current and deferred taxes
Why you need to know this: This additional detail helps you better understand the make up of assets, liabilities, and other financial items.
Legal proceedings
Notes often reveal contingent liabilities or pending legal actions that could impact the company’s future financial health. These are potential liabilities that have not yet been recognized in the financial statements because the outcome is uncertain. Examples include lawsuits, regulatory actions, or potential fines.
Why you need to know this: This information is crucial because it highlights risks that may not be immediately evident from the financial statements.
Commitments
Commitments are obligations that the company has agreed to fulfill in the future, such as leases, purchase contracts, or debt agreements. These may not yet appear on the balance sheet but are detailed in the notes.
Why you need to know this: Knowing a company’s future commitments gives you great insight into its future cash flow needs and financial flexibility.
Significant events
Any major events that occurred during or after the reporting period that could affect the company’s financial position will be covered here. These may include acquisitions, mergers, major asset sales, or changes in company structure.
Why you need to know this: This helps you to understand potential future impacts on the company’s financial health or operations.
Segment information
Many companies operate in multiple business lines or geographical regions. The notes often include segmented financial data, showing how each segment contributes to revenue, profit, and assets.
Why you need to know this: Segment reporting provides a clearer view of where the company’s strengths and vulnerabilities lie, especially for diversified companies.
Tax information
The information often provides a detailed explanation of the company’s tax situation, including deferred taxes, tax credits, or provisions for tax liabilities.
Why you need to know this: It’s best to know how much of the company’s earnings are being allocated to taxes and whether the company has tax-related risks.
Earnings per share calculation
The notes explain how the EPS is calculated, including the number of outstanding shares and the impact of any convertible securities or stock options that could dilute the EPS.
Why you need to know this: A clear understanding of EPS calculation helps you evaluate the company’s profitability on a per-share basis and have a sense of the potential for dilution, which could affect your holdings.
Financial Ratios
As you know by now, financial ratios are key metrics that help investors like you, analysts, and company management assess various aspects of a company's financial performance. These ratios provide insights into a company’s liquidity, leverage, operational efficiency, profitability, and market value, helping stakeholders make more informed decisions. Here’s an overview of some of the most commonly used financial ratios under different categories:
Liquidity ratios
We’ve already discussed these two ratios in an earlier section, but it’s important for you to be able to classify them as liquidity ratios. As we’ve said, these types of ratios measure a company’s ability to meet its short-term obligations using its most liquid assets. These ratios are crucial for determining whether a company has enough resources to pay off its immediate liabilities.
Current ratio: assesses the company’s ability to pay short-term obligations.
Quick ratio: is a stricter measure of liquidity, excluding inventory, as it may not be easily converted into cash. It shows whether the company can meet its short-term obligations without relying on inventory sales.
Financial leverage ratios
Leverage ratios measure the extent to which a company is using debt to finance its operations. High leverage can indicate a higher risk of insolvency, especially in economic downturns.
Debt-to-equity ratio: compares a company’s total debt to its equity.
Interest-coverage ratio: shows how easily a company can cover its interest payments with its operating income. A higher ratio indicates that the company is more capable of meeting its debt obligations.
Efficiency ratios
Efficiency ratios measure how effectively a company uses its assets and manages its operations. These ratios provide insight into how well a company is managing its resources to generate revenue.
Asset turnover ratio: measures how efficiently a company uses its assets to generate sales. A higher ratio indicates better use of assets to drive revenue.
Inventory turnover ratio: shows how many times a company’s inventory is sold and replaced over a period. A higher ratio suggests efficient inventory management and strong sales.
Receivables turnover ratio: measures how efficiently a company collects payments from its customers. A higher ratio indicates faster collection of receivables, improving liquidity.
Profitability ratios
Profitability ratios assess how good a company is at generating earnings relative to its revenue, assets, equity, and other resources. These ratios help you evaluate a company’s overall financial performance.
Gross profit margin: measures the percentage of revenue that exceeds the COGS. A higher margin indicates greater efficiency in production and pricing.
Operating profit margin: measures the percentage of revenue remaining after operating expenses are deducted. It reflects how efficiently the company operates its core business.
Net profit margin: shows the percentage of revenue that remains as profit after all expenses, taxes, and interest have been deducted. A higher margin reflects stronger overall profitability.
Return on assets (ROA): measures how effectively a company uses its assets to generate profit. The higher the number the better.
Return on equity: measures the return generated on shareholders' equity. The higher the better, although you should know that this number is different across industries.
Market-value ratios
If you’ve been trying to get on top of the investment game, you’ll have heard about these ratios. Market value ratios help you evaluate the current price of a company’s stock relative to its earnings, dividends, and other financial metrics. These ratios are commonly used to assess whether a stock is fairly valued, overvalued, or undervalued in the market.Price-to-earnings (P/E) ratio:

The P/E ratio compares a company’s stock price to its earnings per share. A higher ratio indicates that investors expect future growth, while a lower ratio suggests the stock may be undervalued or facing challenges.
Tip: A P/E ratio below 15 might point to undervaluation, while a ratio above 25 could mean the stock is overvalued, though this varies by industry. Growth companies often have higher P/E ratios, while mature firms show lower ones.Price-to-book (P/B) ratio:
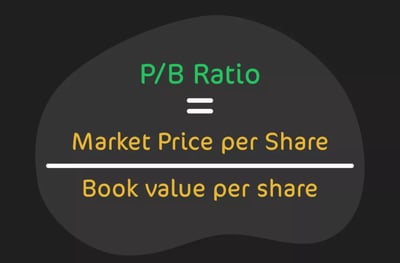
The P/B ratio compares a company’s market value to its book value (net assets). A ratio below 1 may indicate that the stock is undervalued, while a higher ratio suggests investors expect growth.
Tip: A higher P/B ratio, typically above 3.0, often points to investor optimism about future growth. This ratio is very insightful for asset-heavy industries like banking or manufacturing.Dividend Yield:

The dividend yield measures the return on investment provided by dividends. A higher yield indicates that the company is returning more income to shareholders in the form of dividends relative to its stock price.
Tip: Dividend yields between 2-4% can safely be called healthy, though yields above 5% might mean that the dividend is unsustainable.Earnings Per Share:
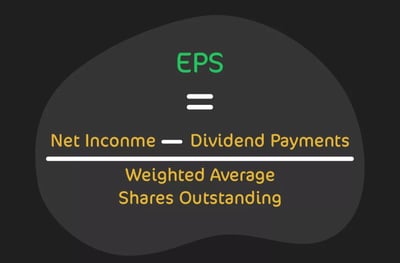
As I've said, EPS shows how much profit is allocated to each share of stock. Higher EPS indicates greater profitability per share, making it a key metric for investors like you.
Tip: An increasing EPS indicates growing profitability, which is always positive. Be wary of companies with volatile EPS, as it may signal inconsistent performance.
Why Are Financial Ratios So Widely Used?
The simple truth is that there is no other reliable way to measure company performance over time in a consistent manner. Financial reporting is a mandatory condition to running a business, as deemed by regulators and tax authorities around the world.
From detailed financial reporting comes highly useful financial ratios, which are widely used because they provide a simple, efficient way to assess a company's financial health, performance, and potential for future growth.
By using ratios, all stakeholders can easily get insights into various aspects of a company's financial standing without having to sift through large volumes of data in financial statements. Why are financial ratios so popular? Here’s what it boils down to:
They simplify complex data
Financial statements can be overwhelming, filled with endless raw numbers that are difficult to interpret at a glance. Financial ratios simplify this complexity by condensing financial information into easy-to-understand metrics. For example, instead of having to review all components of current assets and liabilities individually, you can calculate the current ratio to get a quick snapshot of liquidity.
Comparability
Ratios allow for direct comparisons among companies, regardless of size or industry. When lots of financial data can be simplified into relative terms, ratios make it easier to compare a company’s performance with industry peers or competitors. For example, the price-to-earnings P/E ratio helps compare the valuation of two companies. At the time of writing, the P/E ratio of Microsoft, Meta, and Amazon was 35.1, 35.1, and 43.2 respectively.
Trend analysis
Financial ratios are useful for tracking a company’s performance over time. By calculating ratios for different reporting periods, you can detect trends in profitability, liquidity, or leverage. For instance, a declining gross profit margin over several quarters may signal that the company is grappling with increasing costs or pricing pressure.
Evaluation of financial health
Ratios provide insight into critical areas of a company's financial health, such as:
Liquidity: Ratios like the current ratio and quick ratio reveal whether a company can meet its short-term obligations.
Leverage: Ratios such as the debt-to-equity ratio show how much of the company’s capital structure is financed through debt, helping assess financial risk.
Profitability: Ratios like the net profit margin and ROE measure how effectively a company converts revenue into profit and rewards shareholders.
Efficiency measurement
Financial ratios help measure a company's operational efficiency. For example, the inventory turnover ratio tells you how well the company is managing its inventory, and the asset turnover ratio measures how efficiently the company is using its assets to generate revenue. These insights are valuable for firms that use a lot of raw materials as inputs.
Investment decision-making
Investors rely heavily on financial ratios to make informed decisions about buying, holding, or selling stocks. Ratios like EPS, dividend yield, and P/B help you judge the potential return on investment and whether a stock is undervalued or overvalued.
Risk assessment
Financial ratios allow you to assess the risk profile of a company. For example, the interest coverage ratio helps determine whether a company can comfortably meet its interest obligations on outstanding debt, which is a big thing for evaluating financial stability.
Benchmarking
By using rations, you can benchmark a company’s performance against industry standards or competitors. For example, if a company's operating profit margin is below the industry average, it could tell you that the company is inefficiently run.
Comprehensive performance assessment
Financial ratios cover a wide range of performance indicators—from liquidity and solvency to profitability and market valuation. They really are the Swiss army knife of company analysis!.
Ease of calculation
Once you understand them, you will find out that ratios are easy to calculate using information readily available in financial statements you can easily get online. They do not need complex modeling or advanced technical knowledge.
Features of Financial Statements
For all the information we’ve given you about financial reporting, let’s take this opportunity to go over the most important features of financial statements:
Comprehensive overview: Financial statements provide a complete picture of a company’s financial health by covering various aspects of its operations.
Structured format: Financial statements follow a structured format such as GAAP or IFRS.
Historical data: Financial statements typically present historical data for a specific period, such as a quarter or fiscal year. By reviewing historical financial data, you can track a company’s performance trends and make informed predictions about future performance.
Legal compliance: Financial statements are a legal requirement for publicly traded companies and certain privately held companies, particularly those that are regulated or have complex ownership structures.
Audited for accuracy: For public companies and large private firms, financial statements are often subject to external audits. Independent auditors review the company’s financial records and validate the accuracy of the statements to ensure they provide a true and fair view of the company's financial position.
Comparability: One of the key features of financial statements is that they enable comparability over time and across different companies.
Periodic reporting: Financial statements are prepared and presented periodically—usually on a quarterly and annual basis.
Notes and explanations: Financial statements include notes and footnotes that provide further context, explanations, and breakdowns of the numbers.
Clarity and transparency: Financial statements aim to provide clear and transparent information about a company’s financial performance. Transparency is crucial for building trust among investors, regulators, and other stakeholders.
Cash-flow insights: The cash-flow statement is a critical part of the financial statements, providing insights into the company’s liquidity. It shows how much cash is generated or used in operating, investing, and financing activities.
Support decision-making: Financial statements play a key role in decision-making for various stakeholders. You can use them to decide whether to buy, sell, or hold shares.
Tips You Should Know About Financial Statements
If you take anything away from this article, it should be this next section. Understanding and analyzing financial statements helps you make informed investment decisions. Whether you're a newbie or you already have some investment experience, here are some essential tips you should know about financial statements:
1. Know the three core statements
The balance sheet, income statement, and cash flow statement are the main financial reports you need to know. Each serves a different purpose:
Balance sheet: Provides a snapshot of the company’s assets, liabilities, and shareholders’ equity at a specific point in time.
Income statement: Shows the company’s profitability by reporting revenues, expenses, and net income over a period.
Cash flow statement: Monitors how cash moves in and out of the company through operations, investments, and financing activities.
2. Focus on trends, not just one period
It’s important to look at trends over multiple periods. One set of financial results may not tell the full story, but trends can reveal growth patterns, emerging problems, or improving performance.
3. Understand key financial ratios
Financial ratios provide deeper insights into a company’s performance and financial health. Some of the most important ratios to analyze include:
Liquidity ratios: Like the current ratio and quick ratio, which measure the company’s ability to meet short-term obligations.
Profitability ratios: Like gross profit margin, net profit margin, and ROE, which indicate how well the company is generating profit.
Leverage ratios: Like the debt-to-equity ratio, which shows how much debt the company is using to finance its operations.
4. Check for consistency and comparability
Financial statements are valuable tools for comparing companies, but it’s no point if two companies don’t use the same accounting standard. Consistent practices make it easier to evaluate performance and make comparisons among competitors.
5. Look beyond revenue to profit margins
Revenue growth is important, but profit margins can give you a clearer picture of a company’s operational efficiency. Pay attention to:
Gross profit margin: This reflects how efficiently the company produces goods or services.
Operating profit margin: This shows how well the company is managing its operating expenses.
Net profit margin: This represents the final profitability after all expenses, taxes, and interest have been accounted for.
6. Understand cash flow vs. profitability
A company may report a profit on its income statement but still face liquidity issues if it doesn't manage its cash flow effectively. The cash-flow statement reveals whether the company has enough cash to cover its expenses, reinvest in the business, and pay dividends. Remember that operating cash flow should be positive and sustainable, showing the company’s core business is generating enough cash to cover day-to-day expenses.
7. Watch for red flags in the balance sheet
The balance sheet can reveal warning signs of financial instability. Look out for:
High levels of debt relative to equity (high debt-to-equity ratio) which quite possibly means the company is over-leveraged.
Declining current assets or increasing current liabilities, which may point to liquidity problems.
Negative working capital could be a sign that the company is struggling to meet short-term obligations.
8. Evaluate the quality of earnings
Not all earnings are created equal! Look at where the company’s profits are coming from. Are they from core operations, or are they largely driven by one-off items like asset sales, tax benefits, or accounting adjustments? Sustainable earnings that come from core operations are a much better indication of future profitability than one-time profit bumps.
Conclusion
In my opinion, mastering financial reports is important if you are aiming to make informed decisions about which stocks to invest in. Each statement—whether it's the income statement, balance sheet, or cash flow statement—offers a view into a company's performance, stability, and growth potential. While financial reports might seem daunting initially, they empower you to assess a company’s profitability, liquidity, and operational health. If this is your first exposure to financial reporting, you could be forgiven for wondering why you didn’t start doing it sooner. What you will have seen is that these reports provide a comprehensive way to evaluate whether a stock aligns with your personal investment goals. Understanding financial reports not only helps in making better investment decisions but overall makes you a better trader.
FAQ
A financial report, also called a financial statement, provides a formal record of a company’s financial activities over a specific period, helping stakeholders evaluate its financial health.
The primary components include the balance sheet, income statement, cash-flow statement, and the statement of shareholders' equity.
They offer insight into profitability, liquidity, and stability, enabling investors to make informed decisions about buying, holding, or selling stocks
An annual report provides a detailed overview of a company's operations and performance, while a 10-K filing is a more formal, detailed document submitted to the SEC, focusing on financial data and risks.
The balance sheet helps assess the company’s assets, liabilities, and equity, giving insights into its solvency and financial health at a specific point in time.
It summarizes revenues, expenses, and profits over a specific period, highlighting whether the company made a profit or incurred a loss.
It tracks cash inflows and outflows, offering insights into how well the company manages its cash to fund operations and growth.
Ratios provide deeper insights into a company’s financial health by measuring profitability, liquidity, leverage, and operational efficiency.
The notes provide additional details and context, such as accounting policies, legal proceedings, and future commitments, enhancing transparency.
They help management track performance against strategic goals, identify areas for improvement, and make decisions on cost management, investments, and expansion.


