Most Important Financial Ratios in Stock Trading and What They Mean
Financial ratios in stock trading can quickly reveal whether a company is profitable, liquid, efficient, or carrying too much debt. For investors and analysts, they offer a fast way to compare businesses, spot trends, and make more informed decisions. No single ratio tells the whole story, but together they provide a clearer picture of a company’s financial health and performance. In this article, you’ll learn what financial ratios are, why they matter, and how they can support smarter trading decisions over time.
Financial ratios assess profitability, liquidity, efficiency, solvency, and market valuation to evaluate a company’s financial health
They allow investors to compare companies of different sizes and track changes over time using consistent metrics
Price‑to‑earnings (P/E) ratio shows how much investors pay for each dollar of earnings and helps flag over‑ or undervaluation
Return on equity (ROE) measures how efficiently a company uses shareholder capital to generate profits
Debt‑to‑equity (D/E) ratio reveals the balance of debt and equity in financing and indicates financial leverage risk
Price‑to‑book (P/B) ratio compares market value to book value, useful for assets‑heavy industries or liquidation assessments
Current ratio gauges short‑term liquidity by comparing current assets to current liabilities and highlights solvency
Earnings per share (EPS) shows profitability per share and forms the basis for several valuation metrics
What are financial ratios?
I've seen how many new retail traders are obsessed with a company's share price; in particular, how that share price moves up and down on a stock exchange. In the crudest terms, up is good and down is bad. However, there are many more subtle and useful ways to measure company performance.
One of them involves financial ratios, which are fundamental tools in stock trading. They give you a clear and concise way to assess a company's financial health and performance by comparing different financial metrics, allowing for informed decision-making.
Understanding financial ratios is essential for weighing up a company's potential for growth, comparing it to industry peers, and identifying trends over time. Whether it’s assessing how efficiently a company uses its assets or judging its ability to meet short-term obligations, financial ratios can help you make strategic investment choices.
Why are financial ratios important in stock trading?
Financial ratios are important in stock trading because they help investors evaluate a company’s financial health and support better investment decision-making. They simplify complex financial data into measurable indicators that are easier to compare and interpret. This makes it easier to assess performance, spot risks, and judge whether a stock deserves closer attention.
Financial snapshot
First, they provide a snapshot of a company's financial health, allowing investors and analysts to quickly assess its financial position without reading extensive financial reports. Ratios condense complex financial data into manageable snapshots that show off a company’s operational efficiency, liquidity, profitability, and solvency. This knowledge can help you better choose which stocks to invest in.
Like-for-like comparison
Second, financial ratios enable comparisons across companies, regardless of size. This standardization is crucial because it enables apples-to-apples comparisons, enabling evaluation of how a company stands relative to its peers in the same industry. For example, comparing the price-to-earnings (P/E) ratios of companies can indicate which stocks are undervalued or overvalued relative to the industry average.
We’ve written an article on the top five sectors in which to invest.
Decision-making aids
Third, financial ratios play a significant role in decision-making. Investors rely on these ratios to make informed decisions about buying, holding, or selling stocks. For instance, a high return on equity (ROE) may signal a profitable investment, whereas a high debt-to-equity ratio may indicate financial risk. These metrics help investors gauge the possibility of future returns and the associated risks.
Trend capturing
Finally, tracking financial ratios over time helps highlight trends and potential issues before they become critical. For instance, a declining current ratio over several quarters may indicate worsening liquidity, prompting further investigation. On the other hand, improving profitability ratios may reveal that a company’s strategic initiatives are paying off. By monitoring these trends, you can identify early warning signs and adjust your strategies accordingly.
In practice, I find that reviewing ratio trends across at least four consecutive quarters is usually more reliable than reacting to a single reporting period, especially when seasonal effects can distort the numbers.
Join a Trading Community That Moves Together
Follow top traders and learn from real strategies.
Like, comment, and engage with other investors.
Discover experts through transparent performance data.
Connect with a community built on trust and results.
Grow your knowledge while trading smarter together.
.webp)
What are the main types of financial ratios?
Financial ratios are commonly grouped into categories such as profitability ratios, liquidity ratios, and valuation ratios. Each type highlights a different aspect of a company’s performance and financial condition. Organizing them by theme makes it easier to understand how they are used in stock analysis.
Evaluation Ratios
These are financial metrics used to measure a company's performance and valuation. They help you compare a company's current financial status with its historical data, industry benchmarks, or other companies. Here are some of the most common evaluation ratios:
P/E Ratio
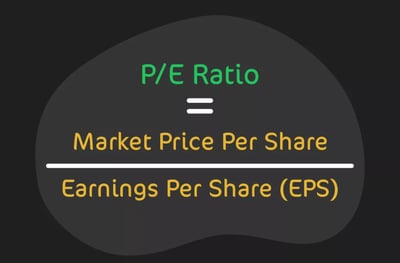
The P/E ratio is one of the most widely used valuation metrics in stock trading. It measures the current share price relative to the per-share earnings, providing information on how much investors are willing to pay today for a dollar of earnings. For example, a P/E ratio of 20 means that investors are willing to pay $20 for every $1 of earnings the company generates.
A P/E ratio of 8 could be considered low. This might suggest that the market perceives the stock as undervalued, possibly because the company is facing such challenges as declining sales, increasing competition, or other operational difficulties. However, it could also indicate a potential opportunity if the company's fundamentals are strong and the market is simply overlooking it.
A P/E ratio of 40 could be considered high. This might indicate that the market expects significant future earnings growth from the company. Investors may be willing to pay a premium for the stock, anticipating that the company will continue to perform well and increase its profits over time. However, a high P/E ratio also comes with risks, as it might mean the industry is in a bubble waiting to burst, such as the dot-com bubble of the early 2000s.
At the time of writing, the darling of the stock market, Nvidia, had reached a peak P/E ratio of 100 (which has since returned to roughly half of that)! Consider the P/E ratio alongside other financial metrics and industry norms, as sectors have varying average P/E ratios.
Price/Earnings Growth (PEG) Ratio
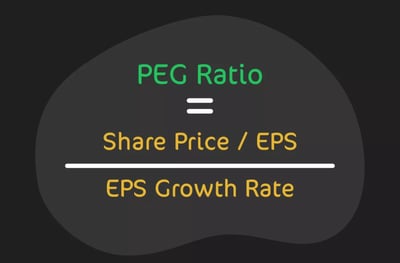
I would say that the PEG ratio refines the P/E ratio by incorporating earnings growth rates into the analysis. It is designed to provide a more complete picture by evaluating whether a stock's high P/E ratio is justified by its growth prospects. A PEG ratio of 1 indicates a perfect correlation between market value and earnings growth, while a PEG greater than 1 may signal overvaluation, and less than 1 may suggest undervaluation. At the time of writing, Nvidia’s PEG ratio was 1.33, showing that the stock was likely overvalued.
This metric is especially useful for comparing companies in high-growth industries like tech where high P/E ratios are common. This type of shorthand is very useful when you are considering putting money on a highly valued stock.
Price to Sales (P/S) Ratio
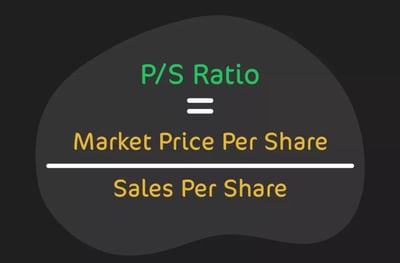
The P/S ratio measures the value investors put on a company’s sales or revenues. Unlike the P/E ratio, the P/S ratio can be useful for measuring companies that do not have positive earnings, such as startups or companies in cyclical or seasonal industries. For example, you would expect a coffee broker to make more sales in the winter than you would in the summer.
It helps investors determine how much they pay for a dollar of sales. A lower P/S ratio might suggest that the stock is undervalued, while a higher P/S ratio could suggest the stock is overvalued. However, it’s important to compare this ratio with industry peers to get a better sense of relative valuation.
Price to Cash Flow (P/CF) Ratio

In my experience, I've seen that the P/CF ratio compares a company’s market price to its cash flow per share, providing insight into the valuation relative to the actual cash generated by the company. This ratio is particularly useful for assessing companies with significant non-cash expenses, such as depreciation, which can distort earnings.
An example of this is Amazon, which is known for its significant capital expenditures and substantial depreciation costs due to its vast infrastructure investments, such as data centers and logistics facilities. These non-cash expenses can significantly impact the company's earnings, making traditional valuation metrics like the P/E ratio less effective.
By using the P/CF ratio, you can better assess Amazon's valuation based on the actual cash it generates, providing a clearer picture of the company's financial health and operational efficiency. This ratio helps to understand whether Amazon's stock price is justified based on its ability to generate cash, which is a critical factor for a company with high levels of reinvestment and non-cash expenses.
A lower P/CF ratio might indicate that the stock is undervalued based on its cash-generating ability, whereas a higher ratio could suggest overvaluation. It is often preferred over the P/E ratio for evaluating companies with substantial capital expenditures.
Market Value to Book Value (P/BV) Ratio
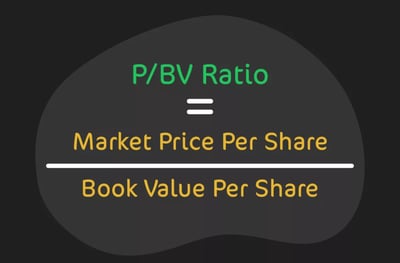
The P/BV ratio compares a company's market value to its book value, reflecting the value investors place on the net assets of the company. The book value is the net asset value according to the balance sheet, and the market value is the current share price. A P/BV ratio less than 1 could indicate that the stock is undervalued, suggesting that the market value is less than the company’s actual net asset value. Conversely, a P/BV ratio greater than 1 might suggest overvaluation. This ratio is especially useful in industries with significant physical assets, such as manufacturing and real estate.
Enterprise Value to Earnings Before Interest, Taxes, Depreciation, and Amortization (EV/EBITDA) Ratio
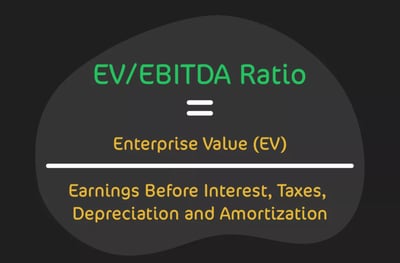
The EV/EBITDA ratio measures the value of a company, including debt and excluding cash, relative to its earnings before interest, taxes, depreciation, and amortization. This ratio is useful for comparing companies with different capital structures because it provides a clearer picture of valuation irrespective of leverage.
An example of such a stock is Netflix (NFLX). Netflix operates with a capital structure that includes significant debt, which it uses to finance its original content production and global expansion.
The EV/EBITDA ratio is valuable for assessing Netflix because it includes the company's debt, giving a fuller view of value than the P/E ratio.
Since Netflix's earnings can be influenced by its debt levels and interest expenses, the EV/EBITDA ratio allows investors to compare Netflix's valuation more fairly against other companies in the media and entertainment industry that may have different capital structures. This ratio helps to focus on the core profitability of the company, excluding the effects of financing decisions.
A low EV/EBITDA ratio may show that a company is undervalued, while a high ratio could suggest overvaluation.
Profitability Ratios
These ratios give you an insight into a company’s ability to generate profit relative to its revenue, assets, equity, or other financial elements. Once you understand how to read them, you can learn how effectively a company is managing its operations to produce earnings. Here are some of the most common profitability ratios:
Return on Equity (ROE)
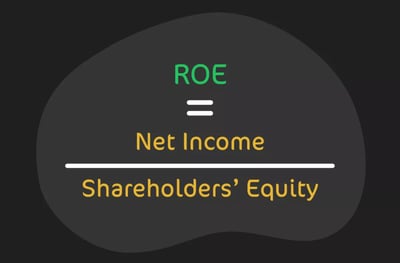
This ratio may be more familiar to a broader range of traders. ROE measures a company's profitability by revealing how much profit a company generates with the money shareholders have invested. It shows how efficiently the management is using the company’s assets to create profits.
A higher ROE suggests that the company is more effective in generating income from new investment dollars. However, it’s important to compare ROE within the same industry, as norms can vary significantly across sectors.
ROE is the ultimate litmus test for a company's ability to generate profits from shareholders' investments. It reveals not just how efficiently management is using equity but also how well the company is poised to grow and reward its investors. In the world of finance, ROE isn't just important—it's the gold standard by which a company's financial strength is judged.
Return on Assets (ROA)
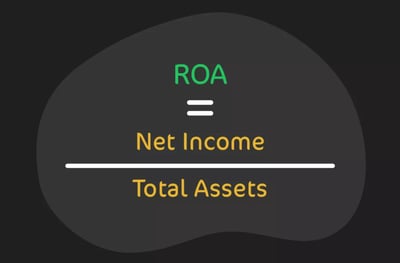
ROA shows a company's profitability relative to its total assets. It gives an idea of how efficient a company's management is at using its assets to generate earnings. A higher ROA indicates a more efficient company in terms of asset utilization. This ratio is particularly useful for comparing companies within the same industry and is a good indicator of operational efficiency.
Return on Invested Capital (ROIC)
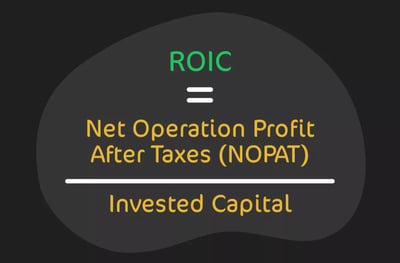
ROIC measures the return that a company earns on the capital invested in its business. It’s a more comprehensive metric than ROE because it includes both debt and equity capital. This ratio helps investors understand how well a company is using its capital to generate profits. A higher ROIC indicates a company is using its capital effectively and can be an indicator of a strong competitive position.
Gross Margin
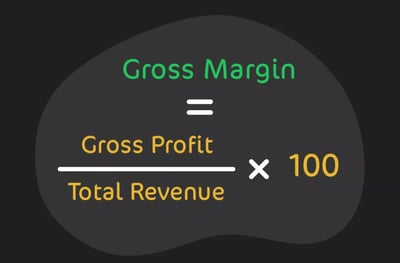
Gross margin indicates the percentage of revenue that exceeds the cost of goods sold (COGS). It shows how well a company is managing its production costs relative to its sales. A higher gross margin means that the company retains more capital for each dollar of sales, which can be used to cover other operating expenses. This ratio is crucial for assessing a company’s core profitability.
Operating Margin
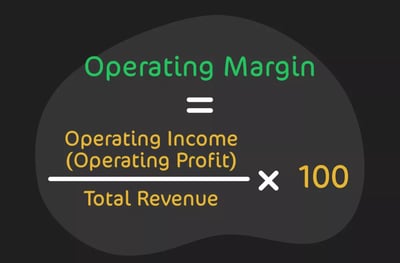
Operating margin measures the proportion of revenue left after paying for variable costs of production, such as wages and raw materials. It indicates how much profit a company makes on a dollar of sales before interest and taxes. A higher operating margin means the company is more efficient at controlling its costs relative to sales. It’s an essential metric for assessing the overall operational efficiency of a company.
Dividend Payout Ratio (DPR)
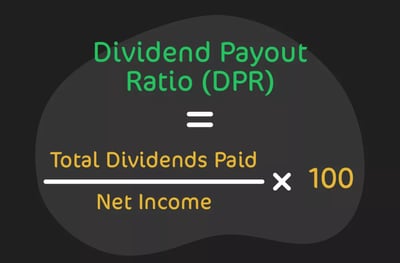
This is an interesting ratio if you want regular dividends from your investment. DPR shows the percentage of earnings distributed to shareholders as dividends. It shows how much of the company’s profits are returned to shareholders versus how much is retained to fund growth.
A lower DPR might suggest that the company is reinvesting most of its earnings into growth opportunities, while a higher DPR indicates a mature company that is returning more income to shareholders. This ratio helps you understand a company’s dividend policy and sustainability.
Liquidity Ratios
Liquidity ratios are financial metrics used to judge a company’s ability to meet its short-term obligations using its most liquid assets. These ratios can tell you a lot about a company’s short-term financial health in case it needs to quickly convert assets into cash to pay off liabilities. Here are the liquidity ratios you need to master:
Quick Ratio
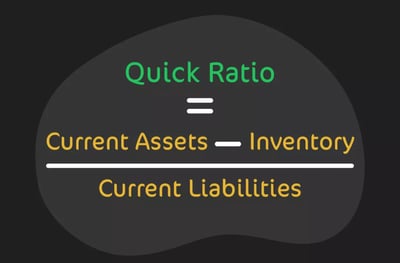
The quick ratio, also known as the acid-test ratio, measures a company's ability to meet its short-term liabilities with its most liquid assets, excluding inventories. It is a stringent liquidity measure because it excludes inventory that may not be readily convertible to cash.
When reviewing balance sheets during earnings season, I usually treat a quick ratio above 1 as an encouraging sign that the company has more liquid assets than short-term liabilities, although I still check whether that level is normal for the sector. On the other hand, a quick ratio below 1 could indicate potential liquidity issues. When it comes to understanding a company's short-term financial health, the Quick Ratio isn't just important—it's absolutely critical.
Current Ratio (General Liquidity Ratio)
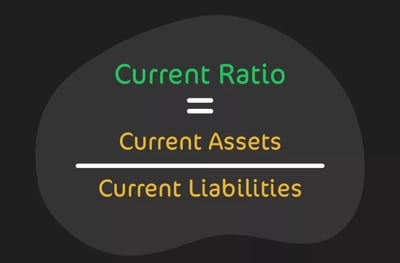
The current ratio measures a company’s ability to pay off its short-term obligations with its current assets. It is a broader measure of liquidity compared to the quick ratio as it includes all current assets.
A current ratio above 1 indicates that the company has more current assets than current liabilities, suggesting good short-term financial health. However, an excessively high current ratio might indicate that the company is not using its assets efficiently to generate revenue.
Inventory Turnover Rate
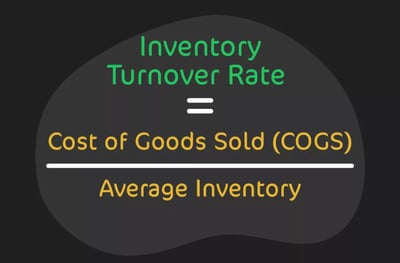
The inventory turnover rate measures how often a company sells and replaces its inventory over a period. A higher turnover rate indicates efficient inventory management and strong sales, while a lower rate may suggest overstocking or weak sales. This ratio helps businesses understand how well they are managing their stock and can indicate potential issues in the supply chain or sales process.
Asset Turnover Rate
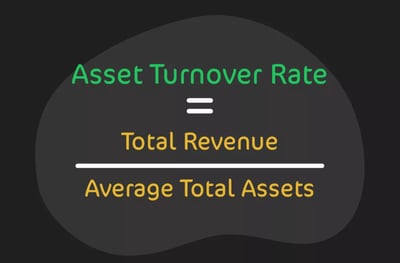
The asset turnover rate measures how effectively a company uses its assets to generate sales. A higher asset turnover ratio indicates efficient asset use in generating revenue, whereas a lower ratio may suggest inefficiencies. This ratio is particularly useful for assessing companies in asset-intensive industries, where managing and optimizing asset use is critical to profitability.
These liquidity and efficiency ratios provide critical insights into a company's operational effectiveness and its ability to manage resources and obligations efficiently. They are essential tools for investors and analysts evaluating a business's financial stability and performance.
Solvency Ratios
Solvency ratios evaluate a company’s ability to meet its long-term obligations and sustain operations over the long term. Here are some key solvency ratios to keep track of:
Debt to Total Assets Ratio
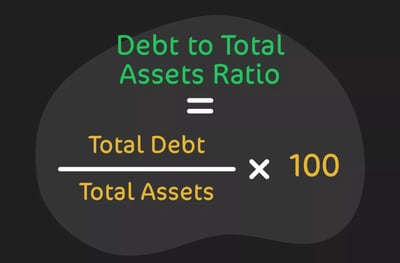
The debt-to-total assets ratio measures the proportion of a company's assets that are financed by debt. This ratio provides insight into the level of financial leverage a company is using. A higher ratio indicates that a larger portion of the company's assets are financed through debt, which can imply higher financial risk.
Conversely, a lower ratio suggests that the company relies more on equity financing and has a lower risk profile. This ratio is crucial for understanding a company's long-term solvency and financial stability, as it reflects the company's ability to meet its long-term obligations.
Debt to Equity (D/E) Ratio
The debt-to-equity ratio compares a company’s total liabilities to its shareholders' equity, indicating the relative proportion of debt and equity used to finance its assets. A higher debt-to-equity ratio indicates greater leverage and may increase financial risk, especially if the company struggles to meet its debt obligations.
A lower ratio suggests a more conservative approach with greater reliance on equity financing. This ratio is a key metric for investors and creditors to assess a company's financial health and risk level, as it shows how much of the company is financed with debt relative to its own funds.
What Are "Ideal Ratios" and Why Are They Ideal?
Often, investors will try to verify if selected ratios exist in ranges considered “ideal” because they strike a balance between value, profitability, and financial stability. These conditions support long‑term, sustainable performance. When a P/E ratio is far below the ideal band, it can signal that the market expects weak growth or sees structural problems, while an excessively high P/E may indicate overvaluation and a heightened risk of multiple compression.
A very low ROE often reflects inefficient use of shareholder capital, whereas an unusually high ROE can be a red flag for excessive leverage or one‑off accounting effects rather than true operational strength. With D/E, too little debt may suggest the company isn’t taking advantage of low‑cost financing to grow, while too much debt increases vulnerability to rising interest rates, earnings volatility, and refinancing risk. In each case, extreme low or high readings tend to point to imbalance rather than opportunity. That’s why these “ideal” ratios work as a practical midpoint where risk, return, and valuation are most aligned, as suggested in the following graphic:
What “Ideal” Looks Like: Optimal Ranges for Key Ratios
Ratios are meaningless without context and benchmarks, and "ideal" is often different across industries
How are financial ratios analysed and used?
In my view, financial ratios are invaluable for analyzing a company’s performance, assessing risk, and making investment decisions. By comparing ratios over time, you can identify trends, such as improving profitability or deteriorating liquidity. Ratios also allow for benchmarking against industry standards, helping investors determine if a company is performing above or below average.
A word of warning: as a relative newcomer, it’s going to be hard for you to remember how to use all these ratios. Most stock investing experts would advise beginner-to-intermediate retail traders to focus on the following key financial ratios:
P/E Ratio
ROE
D/E Ratio
P/B Ratio
Current Ratio
If you have the time and inclination, you can always try to learn the other ratios, but you would be venturing into the realm of a stock market professional, something to which many new traders aspire but realistically cannot manage.
One mistake I’ve repeatedly seen among newer traders is relying on a single ratio in isolation; in most cases, combining valuation, profitability, and debt metrics gives a far more balanced view of the business.
Conclusion
Financial ratios in stock trading help you move beyond price action and understand the real strengths and weaknesses of a business. By looking at measures of profitability, liquidity, efficiency, and solvency, you can compare companies more effectively and spot trends before they become obvious to the wider market. The key is not to rely on just one metric. Instead, use a combination of ratios to build a more complete view of a company’s financial health. If you want to make better investment decisions, start reviewing these ratios regularly and apply them consistently to the stocks you follow.
FAQ
The P/E ratio measures a company's current share price relative to its per-share earnings. It indicates how much investors are willing to pay today for a dollar of earnings, helping to assess whether a stock is undervalued or overvalued.
The PEG ratio adjusts the P/E ratio by incorporating the company’s earnings growth rate, providing a more nuanced view of whether a stock’s high P/E ratio is justified by its growth prospects. A PEG ratio of 1 suggests a fair valuation, while a PEG greater than 1 may indicate overvaluation.
The P/CF ratio is useful for companies with significant non-cash expenses like depreciation, as it provides a clearer picture of the company’s valuation based on the actual cash generated, rather than earnings that may be distorted by these expenses.
A low P/BV ratio, particularly below 1, may indicate that the stock is undervalued, suggesting that the market value is less than the company’s actual net asset value, which can signal a buying opportunity.
The EV/EBITDA ratio provides a clearer picture of valuation by including debt and excluding cash, making it easier to compare companies with different levels of debt, as it focuses on core profitability without the influence of capital structure.
ROE measures how effectively a company is generating profits from shareholders' equity. It’s considered the gold standard for evaluating a company’s financial strength, as it reveals how well management is using equity to grow the business.
The Quick Ratio is stringent because it excludes inventory from current assets, focusing only on the most liquid assets to assess a company’s ability to meet short-term liabilities. This makes it a critical metric for evaluating a company’s immediate financial health.
A high Inventory Turnover Rate suggests that the company is efficiently managing its inventory, with strong sales and frequent stock replacement, which indicates effective supply chain management and strong demand for its products.
Beginners should focus on a small core set: P/E, ROE, debt-to-equity, current ratio, P/B, and EPS. Together, they give a practical view of valuation, profitability, leverage, and short-term financial strength.
The P/E ratio compares a company’s share price with its earnings per share. It helps you judge how much the market is paying for current profits, but it works best when compared with peers and industry norms.
The PEG ratio adds earnings growth to the P/E ratio, giving more context to valuation. It can help show whether a high P/E is supported by growth expectations or whether the stock may already be priced too aggressively.
Ratios can vary widely by sector, so a number that looks strong in one industry may be normal or weak in another. Comparing similar businesses gives a more realistic view of valuation, efficiency, and risk.
ROE shows how efficiently a company turns shareholders’ equity into profit. A higher ROE can be a positive sign, but it should still be checked alongside debt levels and industry averages.
The current ratio uses all current assets to measure short-term financial health, while the quick ratio excludes inventory. That makes the quick ratio a stricter test of whether a company can meet near-term obligations.
The P/CF ratio looks at share price relative to cash flow instead of accounting earnings. It can be especially helpful for companies with heavy depreciation or large capital spending, where earnings may not reflect cash generation clearly.
A low P/B ratio may suggest the stock is trading below the value of its net assets. That can point to undervaluation, but it can also reflect weak business prospects, so it should not be used alone.
The debt-to-equity ratio shows how much a company relies on borrowed money compared with shareholder funds. A higher ratio usually means greater financial risk, especially if earnings weaken or interest costs rise.
No single ratio gives a complete answer. Each one highlights only one part of the business, so investors should combine valuation, profitability, liquidity, and solvency ratios to build a more balanced view.