XOM

Exxon Mobil Corp
D

XOM

117.660
USD
-0.19
(-0.16%)
Market Open
Volume
359,182
EPS
8
Div Yield
3.29
P/E
15
Market Cap
510,717,167,940
Signals
Abdilatif
Abdilatif
7 months ago
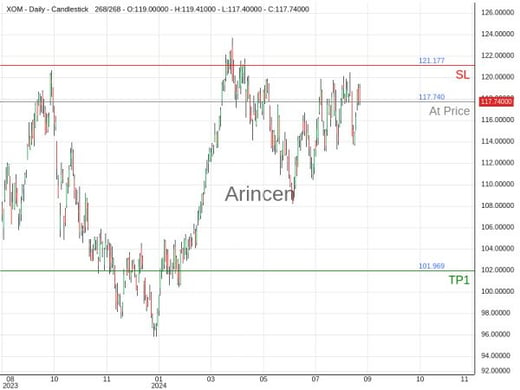
sell
XOM
XOM@117.74
2024-08-28 05:19
XOM@117.74 Chart
Profit
228.00
Abdilatif
Abdilatif
7 months ago
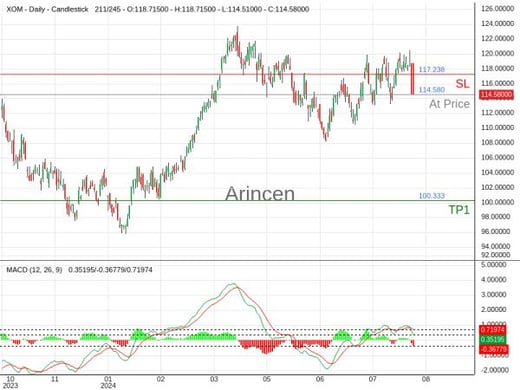
sell
XOM
XOM@114.58
2024-08-21 05:49
XOM@114.58 Chart
Profit
-157.50
sara abdelazim
sara abdelazim
1 year ago
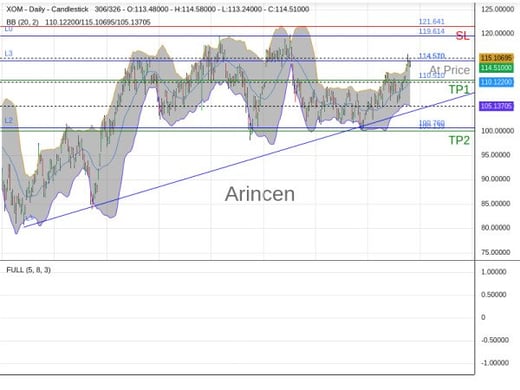
sell
XOM
XOM@114.51
2023-09-07 09:32
XOM@114.51 Chart
Profit
27.50
More
Related Instruments
BP
BP
-0.310
(-0.90%)
34.120 USD
COP
COP
-0.480
(-0.47%)
102.340 USD
CVX
CVX
-0.330
(-0.20%)
166.110 USD
MPC
MPC
-3.160
(-2.14%)
144.190 USD
PSX
PSX
-2.930
(-2.35%)
121.800 USD
VLO
VLO
1.250
(0.94%)
134.470 USD
More
News

Title: Exxon Mobil Corp

Sector: Energy
Industry: Oil & Gas Integrated
ExxonMobil Corporation is an American multinational oil and gas corporation headquartered in Irving, Texas. Formed in 1999 by virtue of a merger between Exxon and Mobil, the company is vertically integrated into the oil and gas industry. It has interests in crude oil and natural gas while also refining petroleum products. It has a chemical segment that sells petrochemicals. ExxonMobil frequently features as one of the world's largest companies by revenue and market capitalization. It has placed as high as number six in recent Fortune 500 rankings. It is commonly regarded as the largest Western-based member of the global Big Oil companies in both production and market value. The company retains significant crude oil reserves and is the second largest oil refiner in the world.
Risk Disclosure: Trading in financial instruments involves high risks including the risk of losing some, or all, of your investment amount, and may not be suitable for all investors. Prices of cryptocurrencies are extremely volatile and may be affected by external factors such as financial, regulatory or political events. Trading on margin increases the financial risks. Before deciding to trade in financial instrument or cryptocurrencies you should be fully informed of the risks and costs associated with trading the financial markets, carefully consider your investment objectives, level of experience, and risk appetite, and seek professional advice where needed. Arincen would like to remind you that the data contained in this website is not necessarily real-time nor accurate. The data and prices on the website are not necessarily accurate and may differ from the actual price at any given market, meaning prices are indicative and not appropriate for trading purposes. Arincen and any provider of the data contained in this website will not accept liability for any loss or damage as a result of your trading, or your reliance on the information contained within this website. It is prohibited to use, store, reproduce, display, modify, transmit or distribute the data contained in this website without the explicit prior written permission of Arincen and/or the data provider. All intellectual property rights are reserved by the providers and/or the exchange providing the data contained in this website. Arincen may be compensated by the advertisers that appear on the website, based on your interaction with the advertisements or advertisers.