 68/100B
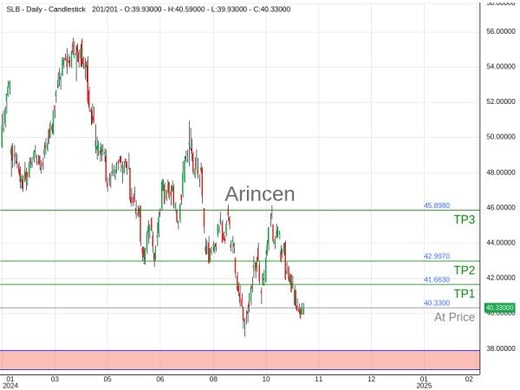
If you had invested in Schlumberger ago, it would be worth $838 today, against $4,128 in SPY and $6,186 in QQQ.
Arincen ScoreBeta
Six parts of the company, five checks each, from its own reported figures. A part scores the checks it passes out of 10; the score is their average out of 100.
Profitability4
Plus shows the checks behind each part of the score, what passed, what failed and the figure it read, for every stock.
Cash10
Plus shows the checks behind each part of the score, what passed, what failed and the figure it read, for every stock.
Valuation7.5
Plus shows the checks behind each part of the score, what passed, what failed and the figure it read, for every stock.
Growth7.5
Plus shows the checks behind each part of the score, what passed, what failed and the figure it read, for every stock.
Financial strength8
Plus shows the checks behind each part of the score, what passed, what failed and the figure it read, for every stock.
Shareholders4
Plus shows the checks behind each part of the score, what passed, what failed and the figure it read, for every stock.
Figures to FY2025; the price as of today.
Schlumberger key facts
- Style
- Dividend stock · 5.5/10Growth 4.3 · Value 5.0 · Dividend 5.5
- Day range
- 49.470 – 51.300
- 52-week range
- 34.650 – 60.460
- Market capitalization
- 73.67B USD
- P/E
- 24.00
- PEG ratio
- 1.88
- EPS
- 2.08
- Div Yield
- 2.36%
- EPS growth forecast (FY2026)
- -16.9%
- Volume
- 765,887
- Beta
- 0.79
- Sector
- Energy
- Industry
- Oil & Gas Equipment & Services
- CEO
- Olivier Le Peuch
- Employees
- 109K
- Website
- slb.com
- IPO date
- 31 Dec 1981
Schlumberger earnings
Revenue
EPS
| Period | Report date | EPS estimate | Reported EPS | Surprise | EPS growth | Revenue estimate | Reported revenue | Surprise | Revenue growth |
|---|---|---|---|---|---|---|---|---|---|
| Q3 FY2028 | 0.94 | — | — | — | 10.98B | — | — | — | |
| Q2 FY2028 | 0.87 | — | — | — | 10.58B | — | — | — | |
| Q1 FY2028 | 0.78 | — | — | — | 10.19B | — | — | — | |
| Q4 FY2026 | 0.73 | — | — | -6.41% | 9.99B | — | — | +2.53% | |
| Q3 FY2026 | 0.62 | 0.64 | +3.73% | -7.25% | 9.27B | 9.45B | +1.91% | +5.84% | |
| Q2 FY2026 | 0.51 | 0.55 | +7.63% | -25.68% | 8.67B | 8.97B | +3.52% | +4.98% | |
| Q1 FY2026 | 0.51 | 0.52 | +2.36% | -27.78% | 8.63B | 8.72B | +1.08% | +2.72% | |
| Q4 FY2025 | 0.74 | 0.78 | +5.12% | -15.22% | 9.55B | 9.75B | +2.01% | +4.97% | |
| Q3 FY2025 | 0.66 | 0.69 | +5.02% | -22.47% | 8.92B | 8.93B | +0.11% | -2.52% | |
| Q2 FY2025 | 0.72 | 0.74 | +2.49% | -12.94% | 8.50B | 8.55B | +0.57% | -6.57% |
| Period | EPS estimate | Reported EPS | Surprise | EPS growth | Revenue estimate | Reported revenue | Surprise | Revenue growth |
|---|---|---|---|---|---|---|---|---|
| FY2028 | 3.67 | — | — | +18.85% | 43.00B | — | — | +6.79% |
| FY2027 | 3.09 | — | — | +26.72% | 40.27B | — | — | +8.55% |
| FY2026 | 2.44 | — | — | -16.87% | 37.10B | — | — | +3.89% |
| FY2025 | 2.88 | 2.93 | +1.77% | -14.08% | 35.53B | 35.71B | +0.49% | -1.63% |
| FY2024 | 3.41 | 3.41 | +0.12% | +14.05% | 36.21B | 36.30B | +0.25% | +9.55% |
| FY2023 | 2.96 | 2.99 | +0.85% | +37.16% | 33.10B | 33.14B | +0.11% | +17.96% |
| FY2022 | 2.15 | 2.18 | +1.38% | +70.31% | 28.03B | 28.09B | +0.23% | +22.51% |
Schlumberger analyst forecast
Analysts' 1-year price targets range from 54.00 to 71.00, with an average of 64.00.
| Strong buy | 0 | |
| Buy | 17 | |
| Hold | 2 | |
| Sell | 0 | |
| Strong sell | 0 |
12-month price target
| Highest target | 71.00 |
| Average target | 64.00 |
| Lowest target | 54.00 |
| Current price | 49.91 |
Schlumberger valuation
- Price to earnings ratio (TTM)
- 24.00
- Forward P/E (FY2026)
- 20.49
- Price to sales (TTM)
- 2.00
- Price to book
- 2.83
- EV / EBITDA (TTM)
- 11.48
Capital structure
Valuation over time
Schlumberger against its own history
Each figure in the latest fiscal year against the same figure from FY2021 to FY2025: the range, its median (the line) and the latest (the dot, green on the good side of the median). The P/E is today's against its daily readings of five years.
Its peers: EOG Resources, Enterprise Products Partners L.P., Kinder Morgan, The Williams Companies, Targa Resources, and MPLX Lp, the US Energy companies closest to it in size, each in its own latest fiscal year: their median (the line) and its rank among them, first being the best.
- P/E (today)Above its median24.010.233.7
- Gross marginBelow its median18.2%16.0%20.6%Against its peers: 6 of 7Peers' median 43.3%
- Operating marginAt its median15.3%12.1%17.4%Against its peers: 6 of 7Peers' median 28.3%
- Net marginBelow its median9.4%8.2%12.7%Against its peers: 7 of 7Peers' median 20.0%
- Return on equityBelow its median12.8%12.5%21.1%Against its peers: 6 of 7Peers' median 20.0%
- Free cash flow marginAt its median12.7%7.1%15.1%Against its peers: 4 of 7Peers' median 11.8%
- Revenue growthBelow its median-1.6%-2.8%22.5%Against its peers: 5 of 7Peers' median 5.7%
- EPS growthLowest in 5 years-24.4%-24.4%81.1%Against its peers: 7 of 7Peers' median 15.8%
- Debt to EBITDAAt its median1.68×1.50×2.82×Against its peers: 2 of 7Peers' median 3.61×
- Current ratioAbove its median1.331.221.45Against its peers: 2 of 7Peers' median 0.85
Peers: US companies of the same industry (of its sector when the industry has too few) from a tenth to ten times its market value, the six closest in size. Updated weekly.
Schlumberger growth and profitability
- Revenue (TTM)
- 36.89B USD
- Net income (TTM)
- 3.07B USD
- Gross margin
- 16.32%
- Operating margin
- 12.58%
- Net margin
- 8.33%
Revenue / Net income
Schlumberger revenue breakdown
By product
| Segment | Revenue | Share of revenue | Change on the year |
|---|---|---|---|
| Production Systems | 13.33B | 38.4% | +9.7% |
| Well Construction | 11.86B | 34.2% | -11.2% |
| Reservoir Characterization | 6.82B | 19.7% | -5.0% |
| Digital Integration | 2.66B | 7.7% | -37.4% |
By region
| Region | Revenue | Share of revenue | Change on the year |
|---|---|---|---|
| Middle East | 12.22B | 34.5% | -6.2% |
| Europe C I S Africa | 9.57B | 27.0% | -1.0% |
| North America | 7.52B | 21.2% | +12.5% |
| Latin America | 6.15B | 17.4% | -8.4% |
How Schlumberger makes its money
FY2025, in USD. Each band is as wide as its money; the percentage is its share of revenue.
FY2025, in USD. Each band is as wide as its money; the percentage is its share of revenue.
Schlumberger dividends
- Annual dividend
- 1.18 USD
- Dividend yield (indicated)
- 2.36%
- Payout ratio
- 70.43%
- Years of dividend growth
- 5
- Frequency
- Quarterly
- Last payment
- 0.30 USD
- Last ex-dividend date
- 2 Dec 2026
- Last payment date
- 7 Jan 2027
Dividends per share
Schlumberger financial health
- Cash and short-term investments
- 3.55B USD
- Total debt
- 12.80B USD
- Net cash
- -9.25B USD
- Free cash flow (TTM)
- 4.47B USD
- Current ratio
- 1.39
- Debt to equity
- 0.49
- Piotroski score
- 5 / 9
- Altman Z-score
- 3.03
Cash, debt and free cash flow
Schlumberger ownership
- Institutions
- 92.56%
- Institutional holders
- 1,809 (+6)
- Free float
- 99.82%
Who owns the shares
Shares free to trade
Closely held shares belong to insiders, founders and owners of more than 5%, and seldom change hands. The free float is the rest: the shares anyone can buy and sell.
Insider trading
| Quarter | Purchases | Sales | Shares acquired | Shares disposed of |
|---|---|---|---|---|
| Q4 2026 | 0 | 4 | 0.00 | 81.03K |
| Q3 2026 | 0 | 4 | 0.00 | 70.00K |
| Q2 2026 | 0 | 5 | 62.83K | 138.76K |
| Q1 2026 | 0 | 10 | 771.35K | 571.86K |
Shares outstanding
Source: Financial Modeling Prep