F
Foot Locker D
D
FL
24.020
USD
-0.10
(-0.39%)
Market Closed
Volume
158,967
EPS
1
Div Yield
-
P/E
-6
Market Cap
2,295,738,162
News


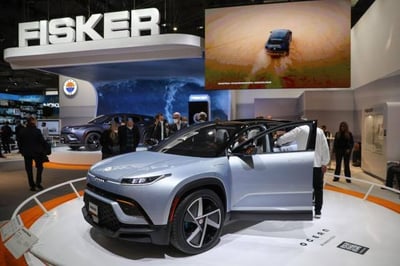
EV Maker Fisker Files for Bankruptcy
1 year ago
Stocks News

More
Title: Foot Locker
Sector: Consumer Cyclical
Industry: Apparel Retail
Foot Locker Inc operates footwear and apparel retailer in North America, Europe, Australia, New Zealand, and Asia, and has licensed store presence in the Middle East, Europe, and Asia. The company mainly sells athletically inspired shoes and apparel. Foot Locker's merchandise comes from only a few suppliers, with Nike providing the majority. Its portfolio of brands includes Foot Locker, Kids Foot Locker, Champs Sports, WSS, and atmos. The company has omnichannel capabilitiesto bridge the digital world and physical stores, including order-in-store, buy online and pickup-in-store, and buy online and ship-from-store, as well as e-commerce. It has three operating segments, North America, EMEA, and Asia Pacific.